
|
Lemon Tree Hotels Limited (Lemonntree.NS) Avaliação DCF |
Totalmente Editável: Adapte-Se Às Suas Necessidades No Excel Ou Planilhas
Design Profissional: Modelos Confiáveis E Padrão Da Indústria
Pré-Construídos Para Uso Rápido E Eficiente
Compatível com MAC/PC, totalmente desbloqueado
Não É Necessária Experiência; Fácil De Seguir
Lemon Tree Hotels Limited (LEMONTREE.NS) Bundle
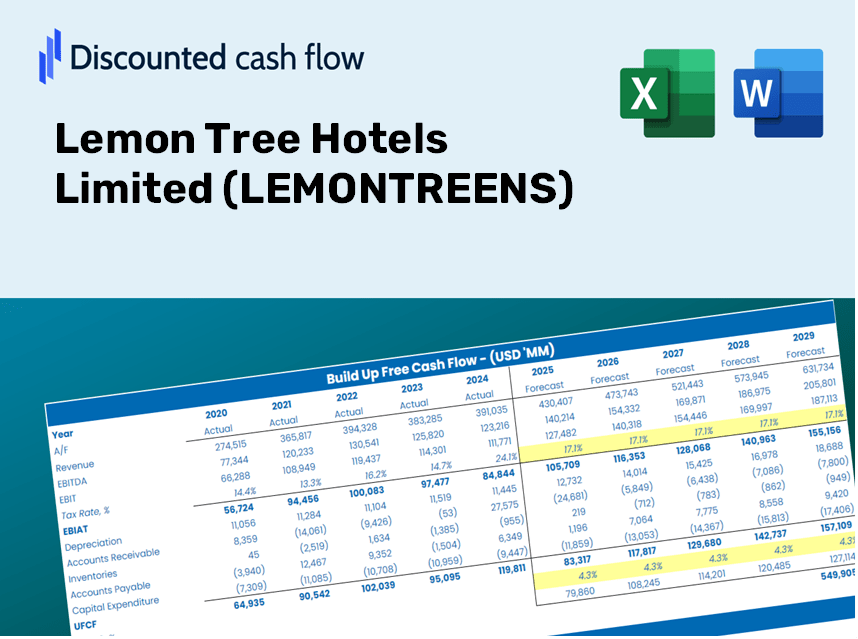
Obtenha informações sobre a análise de avaliação Lemon Tree Hotels Limited (Lemonntreens) com nossa sofisticada calculadora DCF! Apresentando dados reais (Lemonntreens), este modelo Excel o capacita a ajustar as previsões e suposições, permitindo que você determine com precisão o valor intrínseco dos hotéis de limão Limon Limited.
Discounted Cash Flow (DCF) - (USD MM)
| Year | AY1 2021 |
AY2 2022 |
AY3 2023 |
AY4 2024 |
AY5 2025 |
FY1 2026 |
FY2 2027 |
FY3 2028 |
FY4 2029 |
FY5 2030 |
|---|---|---|---|---|---|---|---|---|---|---|
| Revenue | 2,521.0 | 4,026.6 | 8,756.5 | 10,720.3 | 12,860.8 | 19,359.2 | 29,141.2 | 43,865.9 | 66,030.9 | 99,395.6 |
| Revenue Growth, % | 0 | 59.72 | 117.47 | 22.43 | 19.97 | 50.53 | 50.53 | 50.53 | 50.53 | 50.53 |
| EBITDA | 778.2 | 1,396.1 | 4,521.7 | 5,304.5 | 6,470.2 | 8,400.7 | 12,645.4 | 19,035.1 | 28,653.3 | 43,131.5 |
| EBITDA, % | 30.87 | 34.67 | 51.64 | 49.48 | 50.31 | 43.39 | 43.39 | 43.39 | 43.39 | 43.39 |
| Depreciation | 1,075.5 | 1,043.5 | 965.7 | 1,121.0 | 1,393.0 | 3,906.4 | 5,880.3 | 8,851.5 | 13,324.0 | 20,056.5 |
| Depreciation, % | 42.66 | 25.91 | 11.03 | 10.46 | 10.83 | 20.18 | 20.18 | 20.18 | 20.18 | 20.18 |
| EBIT | -297.4 | 352.6 | 3,556.1 | 4,183.6 | 5,077.3 | 4,494.3 | 6,765.2 | 10,183.6 | 15,329.2 | 23,074.9 |
| EBIT, % | -11.8 | 8.76 | 40.61 | 39.03 | 39.48 | 23.22 | 23.22 | 23.22 | 23.22 | 23.22 |
| Total Cash | 1,420.5 | 602.3 | 284.8 | 620.7 | 1,192.5 | 3,470.0 | 5,223.3 | 7,862.6 | 11,835.4 | 17,815.7 |
| Total Cash, percent | .0 | .0 | .0 | .0 | .0 | .0 | .0 | .0 | .0 | .0 |
| Account Receivables | 317.7 | 304.1 | 562.7 | 716.2 | 786.2 | 1,524.5 | 2,294.8 | 3,454.3 | 5,199.8 | 7,827.2 |
| Account Receivables, % | 12.6 | 7.55 | 6.43 | 6.68 | 6.11 | 7.87 | 7.87 | 7.87 | 7.87 | 7.87 |
| Inventories | 72.2 | 81.2 | 105.2 | 138.4 | 138.4 | 327.2 | 492.6 | 741.4 | 1,116.1 | 1,680.0 |
| Inventories, % | 2.87 | 2.02 | 1.2 | 1.29 | 1.08 | 1.69 | 1.69 | 1.69 | 1.69 | 1.69 |
| Accounts Payable | 774.0 | 585.1 | 668.0 | 858.8 | 616.1 | 2,542.4 | 3,827.1 | 5,760.9 | 8,671.8 | 13,053.5 |
| Accounts Payable, % | 30.7 | 14.53 | 7.63 | 8.01 | 4.79 | 13.13 | 13.13 | 13.13 | 13.13 | 13.13 |
| Capital Expenditure | -704.4 | -675.5 | -1,620.4 | -3,311.8 | -957.8 | -3,932.4 | -5,919.4 | -8,910.4 | -13,412.7 | -20,189.9 |
| Capital Expenditure, % | -27.94 | -16.78 | -18.51 | -30.89 | -7.45 | -20.31 | -20.31 | -20.31 | -20.31 | -20.31 |
| Tax Rate, % | 33.7 | 33.7 | 33.7 | 33.7 | 33.7 | 33.7 | 33.7 | 33.7 | 33.7 | 33.7 |
| EBITAT | -172.7 | 213.2 | 2,285.7 | 2,878.3 | 3,366.3 | 2,857.8 | 4,301.8 | 6,475.4 | 9,747.4 | 14,672.7 |
| Depreciation | ||||||||||
| Changes in Account Receivables | ||||||||||
| Changes in Inventories | ||||||||||
| Changes in Accounts Payable | ||||||||||
| Capital Expenditure | ||||||||||
| UFCF | 582.5 | 396.8 | 1,431.2 | 691.7 | 3,488.7 | 3,831.0 | 4,611.7 | 6,941.9 | 10,449.6 | 15,729.7 |
| WACC, % | 4.81 | 4.84 | 4.89 | 4.95 | 4.92 | 4.88 | 4.88 | 4.88 | 4.88 | 4.88 |
| PV UFCF | ||||||||||
| SUM PV UFCF | 34,891.4 | |||||||||
| Long Term Growth Rate, % | 4.00 | |||||||||
| Free cash flow (T + 1) | 16,359 | |||||||||
| Terminal Value | 1,854,240 | |||||||||
| Present Terminal Value | 1,461,020 | |||||||||
| Enterprise Value | 1,495,912 | |||||||||
| Net Debt | 20,670 | |||||||||
| Equity Value | 1,475,242 | |||||||||
| Diluted Shares Outstanding, MM | 791 | |||||||||
| Equity Value Per Share | 1,864.98 |
What You Will Receive
- Customizable Excel Template: A comprehensive Excel-based DCF Calculator featuring pre-loaded financial data for LEMONTREENS (LEMONTREENS).
- Authentic Data: Access to historical performance metrics and forward-looking projections (highlighted in the yellow cells).
- Forecasting Flexibility: Adjust key assumptions such as revenue growth, EBITDA percentage, and WACC.
- Instant Calculations: Quickly see how your adjustments affect the valuation of Lemon Tree Hotels Limited.
- Professional Resource: Designed for investors, CFOs, consultants, and financial analysts.
- User-Friendly Interface: Organized for simplicity and efficiency, complete with step-by-step guidance.
Key Features
- Pre-Loaded Data: Lemon Tree Hotels Limited's historical financial statements and pre-filled forecasts.
- Fully Adjustable Inputs: Modify WACC, tax rates, revenue growth, and EBITDA margins as needed.
- Instant Results: Watch the intrinsic value of Lemon Tree Hotels Limited (LEMONTREENS) update in real time.
- Clear Visual Outputs: Dashboard charts illustrate valuation results and essential metrics.
- Built for Accuracy: A professional-grade tool designed for analysts, investors, and finance professionals.
How It Functions
- Step 1: Download the Excel template.
- Step 2: Examine Lemon Tree Hotels Limited’s (LEMONTREENS) pre-filled financial metrics and projections.
- Step 3: Adjust essential parameters such as occupancy rates, average daily rate (ADR), and operational costs (highlighted cells).
- Step 4: Observe the DCF model refresh in real-time as you modify your inputs.
- Step 5: Evaluate the outcomes and leverage the insights for your investment strategies.
Why Opt for This Calculator?
- Accurate Insights: Utilize genuine Lemon Tree Hotels Limited (LEMONTREENS) financial data for trustworthy valuation outcomes.
- Tailorable: Modify essential parameters such as growth rates, WACC, and tax rates to align with your forecasts.
- Efficient: Ready-made calculations save you the hassle of starting from the ground up.
- Professional-Quality Tool: Crafted specifically for investors, analysts, and consultants.
- Intuitive Interface: User-friendly design and guided steps make it accessible for everyone.
Who Can Benefit from This Product?
- Professional Investors: Create comprehensive and trustworthy valuation models for portfolio assessment.
- Corporate Finance Teams: Evaluate valuation scenarios to inform internal strategic decisions.
- Consultants and Advisors: Deliver precise valuation insights for Lemon Tree Hotels Limited (LEMONTREENS) to clients.
- Students and Educators: Utilize real-world data for hands-on practice and teaching in financial modeling.
- Hospitality Enthusiasts: Gain insight into how companies like Lemon Tree Hotels Limited (LEMONTREENS) are valued in the market.
Contents of the Template
- Thorough DCF Model: An editable template featuring in-depth valuation calculations.
- Market Data: Lemon Tree Hotels Limited’s (LEMONTREENS) historical and projected financials preloaded for in-depth analysis.
- Adjustable Parameters: Modify WACC, growth rates, and tax assumptions to explore various scenarios.
- Financial Statements: Comprehensive annual and quarterly breakdowns for enhanced insights.
- Key Financial Ratios: Integrated analysis covering profitability, efficiency, and leverage metrics.
- Dashboard with Visual Representations: Charts and tables providing clear and actionable outcomes.
Disclaimer
All information, articles, and product details provided on this website are for general informational and educational purposes only. We do not claim any ownership over, nor do we intend to infringe upon, any trademarks, copyrights, logos, brand names, or other intellectual property mentioned or depicted on this site. Such intellectual property remains the property of its respective owners, and any references here are made solely for identification or informational purposes, without implying any affiliation, endorsement, or partnership.
We make no representations or warranties, express or implied, regarding the accuracy, completeness, or suitability of any content or products presented. Nothing on this website should be construed as legal, tax, investment, financial, medical, or other professional advice. In addition, no part of this site—including articles or product references—constitutes a solicitation, recommendation, endorsement, advertisement, or offer to buy or sell any securities, franchises, or other financial instruments, particularly in jurisdictions where such activity would be unlawful.
All content is of a general nature and may not address the specific circumstances of any individual or entity. It is not a substitute for professional advice or services. Any actions you take based on the information provided here are strictly at your own risk. You accept full responsibility for any decisions or outcomes arising from your use of this website and agree to release us from any liability in connection with your use of, or reliance upon, the content or products found herein.