
|
Lions Gate Entertainment Corp. (LGF-B) Avaliação DCF |
Totalmente Editável: Adapte-Se Às Suas Necessidades No Excel Ou Planilhas
Design Profissional: Modelos Confiáveis E Padrão Da Indústria
Pré-Construídos Para Uso Rápido E Eficiente
Compatível com MAC/PC, totalmente desbloqueado
Não É Necessária Experiência; Fácil De Seguir
Lions Gate Entertainment Corp. (LGF-B) Bundle
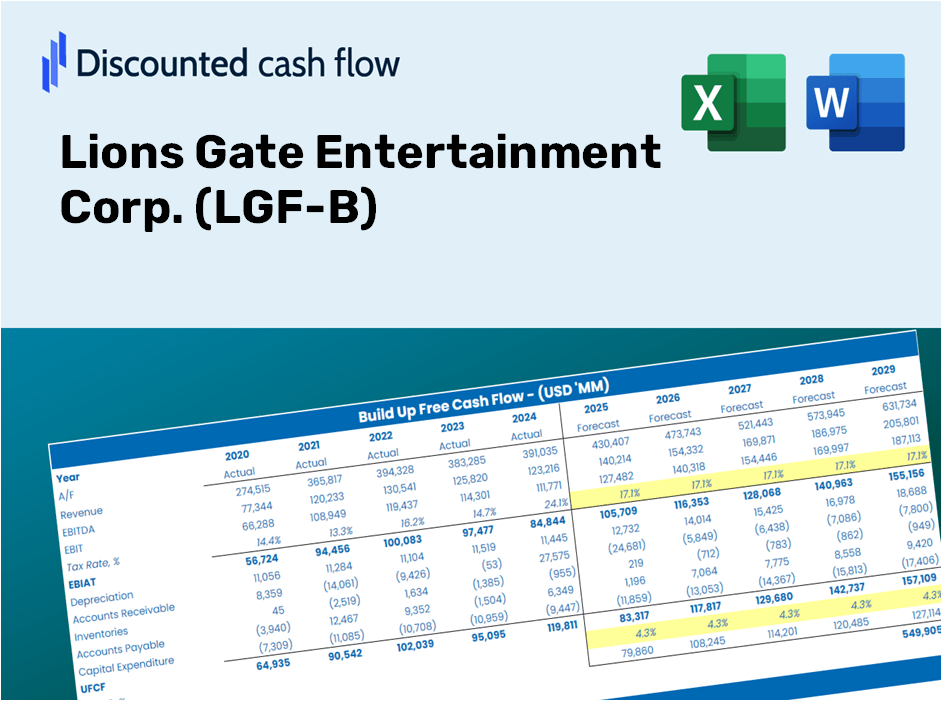
Obtenha informações sobre a análise de avaliação do Lions Gate Entertainment Corp. (LGF-B) usando nossa sofisticada calculadora DCF! Este modelo do Excel é pré-carregado com dados reais (LGF-B), permitindo que você ajuste as previsões e suposições para determinar com precisão o valor intrínseco da Lions Gate Entertainment Corp.
Benefits You Will Receive
- Authentic LGF-B Financials: Features both historical and projected data for precise valuation.
- Customizable Inputs: Adjust metrics such as WACC, tax rates, revenue growth, and capital investments.
- Automated Calculations: Intrinsic value and NPV are computed in real-time.
- Scenario Analysis: Experiment with various scenarios to assess Lions Gate's future performance.
- User-Friendly Design: Crafted for industry professionals, yet easy enough for newcomers to navigate.
Key Features
- Real-Life LGF-B Data: Pre-filled with Lions Gate Entertainment’s historical financials and forward-looking projections.
- Completely Customizable Inputs: Modify revenue growth, profit margins, WACC, tax rates, and capital expenditures to suit your analysis.
- Interactive Valuation Model: Automatic recalculations of Net Present Value (NPV) and intrinsic value based on your customized inputs.
- Scenario Analysis: Develop various forecast scenarios to explore different valuation outcomes.
- User-Friendly Interface: Intuitive, organized, and suitable for both experienced professionals and newcomers.
How It Functions
- Step 1: Download the Excel spreadsheet.
- Step 2: Examine the pre-loaded data for Lions Gate Entertainment Corp. (LGF-B) (historical and forecasted).
- Step 3: Modify key assumptions (highlighted in yellow) according to your analysis.
- Step 4: Observe real-time recalculations for Lions Gate Entertainment Corp.'s intrinsic value.
- Step 5: Utilize the results for your investment strategies or reporting needs.
Why Choose This Calculator for Lions Gate Entertainment Corp. (LGF-B)?
- Designed for Industry Experts: An advanced tool utilized by financial analysts, company executives, and industry consultants.
- Comprehensive Data: Lions Gate's historical and projected financial data is preloaded for precision.
- Flexible Scenario Analysis: Easily simulate various forecasts and assumptions to explore outcomes.
- Intuitive Results: Automatically computes intrinsic value, NPV, and other essential metrics.
- User-Friendly: Clear, step-by-step instructions help you navigate the calculator effortlessly.
Who Can Benefit from This Product?
- Individual Investors: Gain insights to make well-informed decisions on buying or selling Lions Gate Entertainment Corp. (LGF-B) stock.
- Financial Analysts: Enhance valuation methodologies with ready-to-implement financial models tailored to LGF-B.
- Consultants: Provide clients with expert valuation analyses of Lions Gate Entertainment quickly and effectively.
- Business Owners: Learn the valuation principles of prominent companies like Lions Gate to inform your own business strategies.
- Finance Students: Acquire hands-on experience with valuation techniques utilizing real data and case studies related to LGF-B.
What the Template Includes
- Pre-Filled DCF Model: Lions Gate Entertainment Corp.’s (LGF-B) financial data ready for immediate application.
- WACC Calculator: Comprehensive calculations for Weighted Average Cost of Capital.
- Financial Ratios: Assess Lions Gate's profitability, leverage, and efficiency metrics.
- Editable Inputs: Modify assumptions like growth rates, margins, and CAPEX to align with your projections.
- Financial Statements: Access annual and quarterly reports for detailed financial analysis.
- Interactive Dashboard: Easily visualize essential valuation metrics and outcomes.
Disclaimer
All information, articles, and product details provided on this website are for general informational and educational purposes only. We do not claim any ownership over, nor do we intend to infringe upon, any trademarks, copyrights, logos, brand names, or other intellectual property mentioned or depicted on this site. Such intellectual property remains the property of its respective owners, and any references here are made solely for identification or informational purposes, without implying any affiliation, endorsement, or partnership.
We make no representations or warranties, express or implied, regarding the accuracy, completeness, or suitability of any content or products presented. Nothing on this website should be construed as legal, tax, investment, financial, medical, or other professional advice. In addition, no part of this site—including articles or product references—constitutes a solicitation, recommendation, endorsement, advertisement, or offer to buy or sell any securities, franchises, or other financial instruments, particularly in jurisdictions where such activity would be unlawful.
All content is of a general nature and may not address the specific circumstances of any individual or entity. It is not a substitute for professional advice or services. Any actions you take based on the information provided here are strictly at your own risk. You accept full responsibility for any decisions or outcomes arising from your use of this website and agree to release us from any liability in connection with your use of, or reliance upon, the content or products found herein.