
|
Significar N.V. (Light.as) DCF Avaliação |
Totalmente Editável: Adapte-Se Às Suas Necessidades No Excel Ou Planilhas
Design Profissional: Modelos Confiáveis E Padrão Da Indústria
Pré-Construídos Para Uso Rápido E Eficiente
Compatível com MAC/PC, totalmente desbloqueado
Não É Necessária Experiência; Fácil De Seguir
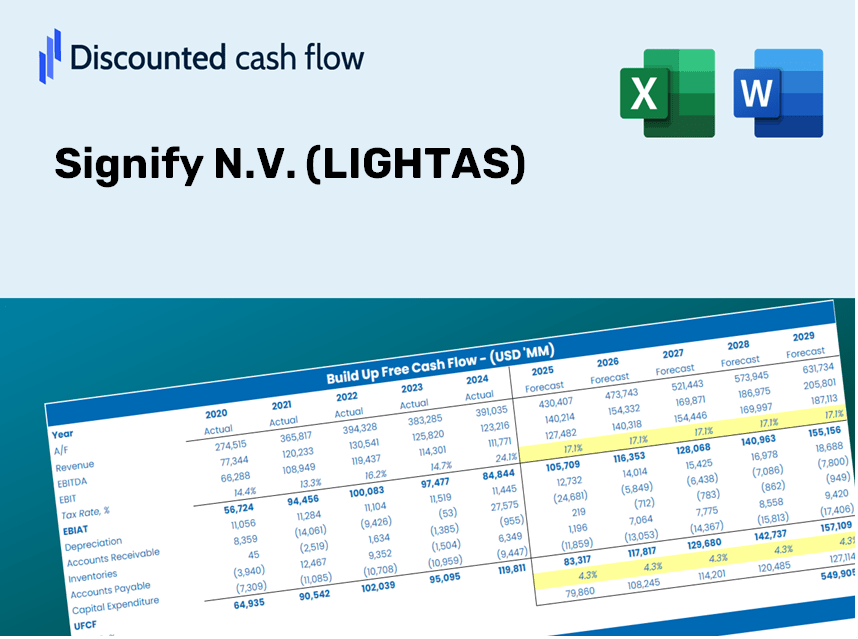
Signify N.V. (LIGHT.AS) Bundle
Avalie o Signifique as perspectivas financeiras de N.V. como um especialista! Essa calculadora DCF (Lightas) fornece dados financeiros pré-preenchidos e toda a capacidade de modificar o crescimento da receita, WACC, margens e outras suposições essenciais para se alinhar às suas previsões.
Discounted Cash Flow (DCF) - (USD MM)
| Year | AY1 2020 |
AY2 2021 |
AY3 2022 |
AY4 2023 |
AY5 2024 |
FY1 2025 |
FY2 2026 |
FY3 2027 |
FY4 2028 |
FY5 2029 |
|---|---|---|---|---|---|---|---|---|---|---|
| Revenue | 6,502.0 | 6,860.0 | 7,514.0 | 6,704.0 | 6,143.0 | 6,079.9 | 6,017.5 | 5,955.6 | 5,894.5 | 5,833.9 |
| Revenue Growth, % | 0 | 5.51 | 9.53 | -10.78 | -8.37 | -1.03 | -1.03 | -1.03 | -1.03 | -1.03 |
| EBITDA | 718.0 | 827.0 | 1,039.0 | 590.0 | 773.0 | 709.0 | 701.8 | 694.5 | 687.4 | 680.4 |
| EBITDA, % | 11.04 | 12.06 | 13.83 | 8.8 | 12.58 | 11.66 | 11.66 | 11.66 | 11.66 | 11.66 |
| Depreciation | 297.0 | 291.0 | 301.0 | 241.0 | 255.0 | 250.0 | 247.5 | 244.9 | 242.4 | 239.9 |
| Depreciation, % | 4.57 | 4.24 | 4.01 | 3.59 | 4.15 | 4.11 | 4.11 | 4.11 | 4.11 | 4.11 |
| EBIT | 421.0 | 536.0 | 738.0 | 349.0 | 518.0 | 459.0 | 454.3 | 449.6 | 445.0 | 440.4 |
| EBIT, % | 6.47 | 7.81 | 9.82 | 5.21 | 8.43 | 7.55 | 7.55 | 7.55 | 7.55 | 7.55 |
| Total Cash | 1,032.0 | 852.0 | 676.0 | 1,158.0 | 633.0 | 788.8 | 780.7 | 772.6 | 764.7 | 756.8 |
| Total Cash, percent | .0 | .0 | .0 | .0 | .0 | .0 | .0 | .0 | .0 | .0 |
| Account Receivables | 1,140.0 | 1,183.0 | 1,158.0 | 966.0 | 1,118.0 | 1,006.8 | 996.5 | 986.2 | 976.1 | 966.1 |
| Account Receivables, % | 17.53 | 17.24 | 15.41 | 14.41 | 18.2 | 16.56 | 16.56 | 16.56 | 16.56 | 16.56 |
| Inventories | 885.0 | 1,410.0 | 1,361.0 | 1,050.0 | 1,035.0 | 1,031.0 | 1,020.4 | 1,009.9 | 999.6 | 989.3 |
| Inventories, % | 13.61 | 20.55 | 18.11 | 15.66 | 16.85 | 16.96 | 16.96 | 16.96 | 16.96 | 16.96 |
| Accounts Payable | 1,089.0 | 1,611.0 | 1,242.0 | 950.0 | 1,042.0 | 1,068.8 | 1,057.8 | 1,046.9 | 1,036.2 | 1,025.5 |
| Accounts Payable, % | 16.75 | 23.48 | 16.53 | 14.17 | 16.96 | 17.58 | 17.58 | 17.58 | 17.58 | 17.58 |
| Capital Expenditure | -99.0 | -118.0 | -132.0 | -110.0 | -99.0 | -100.3 | -99.3 | -98.3 | -97.3 | -96.3 |
| Capital Expenditure, % | -1.52 | -1.72 | -1.76 | -1.64 | -1.61 | -1.65 | -1.65 | -1.65 | -1.65 | -1.65 |
| Tax Rate, % | 16.75 | 16.75 | 16.75 | 16.75 | 16.75 | 16.75 | 16.75 | 16.75 | 16.75 | 16.75 |
| EBITAT | 378.0 | 434.3 | 569.3 | 264.4 | 431.2 | 373.6 | 369.7 | 365.9 | 362.2 | 358.5 |
| Depreciation | ||||||||||
| Changes in Account Receivables | ||||||||||
| Changes in Inventories | ||||||||||
| Changes in Accounts Payable | ||||||||||
| Capital Expenditure | ||||||||||
| UFCF | -360.0 | 561.3 | 443.3 | 606.4 | 542.2 | 665.2 | 527.8 | 522.4 | 517.0 | 511.7 |
| WACC, % | 7.84 | 7.57 | 7.46 | 7.41 | 7.64 | 7.58 | 7.58 | 7.58 | 7.58 | 7.58 |
| PV UFCF | ||||||||||
| SUM PV UFCF | 2,235.0 | |||||||||
| Long Term Growth Rate, % | 0.50 | |||||||||
| Free cash flow (T + 1) | 514 | |||||||||
| Terminal Value | 7,260 | |||||||||
| Present Terminal Value | 5,038 | |||||||||
| Enterprise Value | 7,273 | |||||||||
| Net Debt | 920 | |||||||||
| Equity Value | 6,353 | |||||||||
| Diluted Shares Outstanding, MM | 128 | |||||||||
| Equity Value Per Share | 49.81 |
What You Will Receive
- Genuine Signify N.V. Financial Data: Pre-loaded with historical and projected figures for precise analysis.
- Completely Customizable Template: Easily adjust key inputs such as revenue growth, WACC, and EBITDA %.
- Instant Calculations: Witness the intrinsic value of Signify N.V. update in real-time as you make changes.
- Expert Valuation Tool: Tailored for investors, analysts, and consultants aiming for accurate DCF results.
- Intuitive Design: Streamlined layout and straightforward instructions suitable for all skill levels.
Key Features
- Pre-Loaded Data: Signify N.V.'s historical financial statements and pre-filled forecasts.
- Fully Adjustable Inputs: Modify WACC, tax rates, revenue growth, and EBITDA margins as needed.
- Instant Results: Watch as Signify N.V.'s intrinsic value recalculates in real time.
- Clear Visual Outputs: Dashboard charts showcase valuation results and essential metrics.
- Built for Accuracy: A professional-grade tool designed for analysts, investors, and finance professionals.
How It Operates
- Step 1: Download the pre-built Excel template containing Signify N.V.’s (LIGHTAS) data.
- Step 2: Navigate through the filled sheets to grasp the essential metrics.
- Step 3: Adjust projections and assumptions in the editable yellow cells (WACC, growth, margins).
- Step 4: Immediately view the updated results, including Signify N.V.’s (LIGHTAS) intrinsic value.
- Step 5: Utilize the insights gained to make informed investment choices or create reports based on the findings.
Why Choose the Signify N.V. (LIGHTAS) Calculator?
- Precision: Utilizes authentic Signify financial data for reliable outcomes.
- Versatility: Allows users to easily experiment with and adjust inputs as needed.
- Efficiency: Eliminate the complexity of constructing a DCF model from the ground up.
- Expert-Level: Crafted with the meticulousness and functionality expected by CFOs.
- Intuitive: Simple to navigate, making it accessible for users without extensive financial modeling skills.
Who Can Benefit from This Product?
- Investors: Make informed investment choices by accurately assessing the fair value of Signify N.V. (LIGHTAS).
- CFOs: Utilize a high-quality DCF model for comprehensive financial analysis and reporting.
- Consultants: Efficiently tailor the template for client valuation reports.
- Entrepreneurs: Discover financial modeling techniques employed by leading companies in the industry.
- Educators: Employ this tool for teaching purposes to illustrate valuation strategies.
Contents of the Template
- Preloaded SIGNIFY N.V. Data: Historical and projected financial information, including revenue, EBIT, and capital expenditures.
- DCF and WACC Models: Advanced spreadsheets for calculating intrinsic value and Weighted Average Cost of Capital.
- Editable Inputs: Yellow-highlighted cells for modifying revenue growth, tax rates, and discount rates.
- Financial Statements: Detailed annual and quarterly financial reports for in-depth analysis.
- Key Ratios: Metrics for profitability, leverage, and efficiency to assess performance.
- Dashboard and Charts: Visual representations of valuation results and underlying assumptions.
Disclaimer
All information, articles, and product details provided on this website are for general informational and educational purposes only. We do not claim any ownership over, nor do we intend to infringe upon, any trademarks, copyrights, logos, brand names, or other intellectual property mentioned or depicted on this site. Such intellectual property remains the property of its respective owners, and any references here are made solely for identification or informational purposes, without implying any affiliation, endorsement, or partnership.
We make no representations or warranties, express or implied, regarding the accuracy, completeness, or suitability of any content or products presented. Nothing on this website should be construed as legal, tax, investment, financial, medical, or other professional advice. In addition, no part of this site—including articles or product references—constitutes a solicitation, recommendation, endorsement, advertisement, or offer to buy or sell any securities, franchises, or other financial instruments, particularly in jurisdictions where such activity would be unlawful.
All content is of a general nature and may not address the specific circumstances of any individual or entity. It is not a substitute for professional advice or services. Any actions you take based on the information provided here are strictly at your own risk. You accept full responsibility for any decisions or outcomes arising from your use of this website and agree to release us from any liability in connection with your use of, or reliance upon, the content or products found herein.