
|
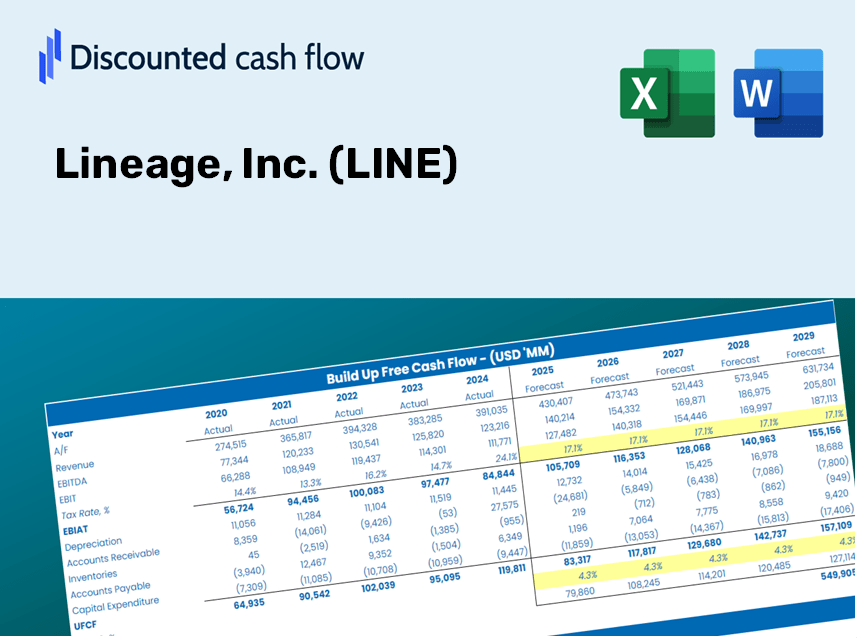
Lineage, Inc. (linha) Avaliação DCF |
Totalmente Editável: Adapte-Se Às Suas Necessidades No Excel Ou Planilhas
Design Profissional: Modelos Confiáveis E Padrão Da Indústria
Pré-Construídos Para Uso Rápido E Eficiente
Compatível com MAC/PC, totalmente desbloqueado
Não É Necessária Experiência; Fácil De Seguir
Lineage, Inc. (LINE) Bundle
Economize tempo e melhore a precisão com nossa calculadora DCF Lineage, Inc. (linha)! Com dados reais de linhagem e suposições personalizáveis, essa ferramenta capacita você a prever, analisar e valorizar a Lineage, Inc. como um investidor experiente.
Benefits You'll Receive
- Pre-Populated Financial Model: Leverage Lineage, Inc.'s actual performance data for accurate DCF valuation.
- Comprehensive Forecast Control: Modify revenue growth, profit margins, WACC, and other essential parameters.
- Real-Time Calculations: Immediate updates allow you to view results instantly as you adjust inputs.
- Professional-Grade Template: A polished Excel file specifically crafted for high-quality valuation.
- Flexible and Reusable: Designed for adaptability, enabling ongoing use for in-depth forecasts.
Key Features
- Authentic LINE Data: Pre-populated with Lineage's historical financial information and future projections.
- Completely Customizable Inputs: Modify revenue growth, profit margins, WACC, tax rates, and capital expenditures to suit your analysis.
- Dynamic Valuation Model: Automatic recalculations of Net Present Value (NPV) and intrinsic value based on your specified parameters.
- Scenario Analysis: Develop various forecast scenarios to explore different valuation possibilities.
- User-Friendly Interface: Intuitive design that caters to both experienced professionals and novices.
How It Works
- Step 1: Download the Excel file for Lineage, Inc. (LINE).
- Step 2: Review the pre-populated financial data and projections for Lineage.
- Step 3: Adjust key inputs such as revenue growth, WACC, and tax rates (highlighted cells).
- Step 4: Observe the DCF model update in real-time as you modify your assumptions.
- Step 5: Evaluate the results and leverage them for your investment decisions involving Lineage, Inc. (LINE).
Why Choose This Calculator for Lineage, Inc. (LINE)?
- User-Friendly Design: Perfectly suited for both novices and seasoned professionals.
- Customizable Inputs: Effortlessly adjust assumptions to tailor your analysis.
- Real-Time Updates: Watch Lineage, Inc. (LINE)'s valuation change instantly as you modify inputs.
- Preloaded Financial Data: Comes equipped with Lineage, Inc. (LINE)'s current financial information for swift evaluations.
- Relied Upon by Experts: Frequently used by investors and analysts for making well-informed decisions.
Who Can Benefit from This Product?
- Individual Investors: Gain insights to make informed decisions about trading Lineage, Inc. (LINE) shares.
- Financial Analysts: Enhance your analysis with ready-to-apply financial models tailored for Lineage, Inc. (LINE).
- Consultants: Provide clients with accurate and timely valuation assessments for Lineage, Inc. (LINE).
- Business Owners: Learn how large firms like Lineage, Inc. (LINE) are appraised to inform your own business strategies.
- Finance Students: Explore valuation methodologies using real-time data and case studies involving Lineage, Inc. (LINE).
Contents of the Template
- In-Depth DCF Model: A customizable template featuring comprehensive valuation calculations.
- Actual Data: Lineage, Inc.’s (LINE) historical and projected financial data preloaded for your analysis.
- Adjustable Variables: Modify WACC, growth rates, and tax assumptions to explore various scenarios.
- Financial Statements: Complete annual and quarterly financial breakdowns for enhanced insights.
- Essential Ratios: Integrated analysis tools for evaluating profitability, efficiency, and leverage.
- Visual Dashboard: Graphs and tables presenting clear, actionable results.
Disclaimer
All information, articles, and product details provided on this website are for general informational and educational purposes only. We do not claim any ownership over, nor do we intend to infringe upon, any trademarks, copyrights, logos, brand names, or other intellectual property mentioned or depicted on this site. Such intellectual property remains the property of its respective owners, and any references here are made solely for identification or informational purposes, without implying any affiliation, endorsement, or partnership.
We make no representations or warranties, express or implied, regarding the accuracy, completeness, or suitability of any content or products presented. Nothing on this website should be construed as legal, tax, investment, financial, medical, or other professional advice. In addition, no part of this site—including articles or product references—constitutes a solicitation, recommendation, endorsement, advertisement, or offer to buy or sell any securities, franchises, or other financial instruments, particularly in jurisdictions where such activity would be unlawful.
All content is of a general nature and may not address the specific circumstances of any individual or entity. It is not a substitute for professional advice or services. Any actions you take based on the information provided here are strictly at your own risk. You accept full responsibility for any decisions or outcomes arising from your use of this website and agree to release us from any liability in connection with your use of, or reliance upon, the content or products found herein.