
|
Lloyds Engineering Works Limited (lloydsengg.ns) Avaliação DCF |
Totalmente Editável: Adapte-Se Às Suas Necessidades No Excel Ou Planilhas
Design Profissional: Modelos Confiáveis E Padrão Da Indústria
Pré-Construídos Para Uso Rápido E Eficiente
Compatível com MAC/PC, totalmente desbloqueado
Não É Necessária Experiência; Fácil De Seguir
Lloyds Engineering Works Limited (LLOYDSENGG.NS) Bundle
Aumente a eficiência e melhore a precisão com a nossa calculadora DCF (LloydSenggn)! Utilizando a Lloyds Engineering real trabalha dados limitados e suposições personalizáveis, essa ferramenta o capacita a prever, analisar e valorizar a engenharia da Lloyds funciona como um investidor experiente.
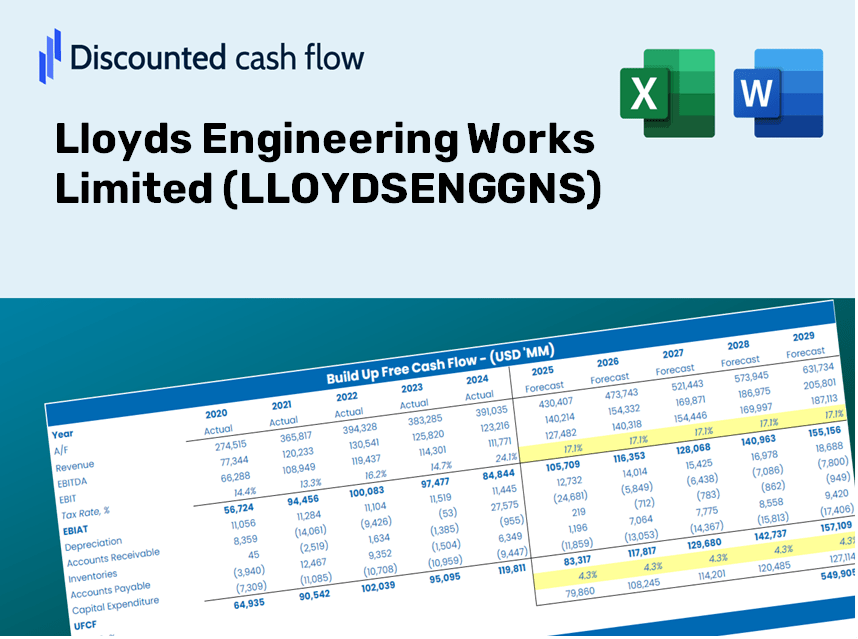
Discounted Cash Flow (DCF) - (USD MM)
| Year | AY1 2021 |
AY2 2022 |
AY3 2023 |
AY4 2024 |
AY5 2025 |
FY1 2026 |
FY2 2027 |
FY3 2028 |
FY4 2029 |
FY5 2030 |
|---|---|---|---|---|---|---|---|---|---|---|
| Revenue | 699.3 | 494.2 | 3,126.1 | 6,219.5 | 8,457.4 | 12,804.8 | 19,386.8 | 29,352.2 | 44,440.2 | 67,283.8 |
| Revenue Growth, % | 0 | -29.32 | 532.53 | 98.95 | 35.98 | 51.4 | 51.4 | 51.4 | 51.4 | 51.4 |
| EBITDA | -106.6 | 144.6 | 555.4 | 1,084.4 | 1,351.7 | 1,670.1 | 2,528.5 | 3,828.2 | 5,796.1 | 8,775.4 |
| EBITDA, % | -15.24 | 29.27 | 17.77 | 17.43 | 15.98 | 13.04 | 13.04 | 13.04 | 13.04 | 13.04 |
| Depreciation | 9.7 | 13.4 | 23.8 | 40.5 | 96.6 | 170.4 | 258.0 | 390.6 | 591.4 | 895.3 |
| Depreciation, % | 1.39 | 2.71 | 0.76216 | 0.65047 | 1.14 | 1.33 | 1.33 | 1.33 | 1.33 | 1.33 |
| EBIT | -116.3 | 131.3 | 531.6 | 1,043.9 | 1,255.1 | 1,499.7 | 2,270.5 | 3,437.7 | 5,204.7 | 7,880.1 |
| EBIT, % | -16.63 | 26.56 | 17.01 | 16.78 | 14.84 | 11.71 | 11.71 | 11.71 | 11.71 | 11.71 |
| Total Cash | 182.9 | 245.9 | 80.7 | 1,249.7 | 1,359.3 | 2,936.5 | 4,446.0 | 6,731.4 | 10,191.5 | 15,430.3 |
| Total Cash, percent | .0 | .0 | .0 | .0 | .0 | .0 | .0 | .0 | .0 | .0 |
| Account Receivables | 375.4 | 98.3 | 290.9 | 1,518.1 | 2,714.5 | 3,569.3 | 5,404.0 | 8,181.9 | 12,387.6 | 18,755.2 |
| Account Receivables, % | 53.68 | 19.88 | 9.31 | 24.41 | 32.1 | 27.87 | 27.87 | 27.87 | 27.87 | 27.87 |
| Inventories | 187.7 | 488.5 | 1,145.8 | 1,019.8 | 862.0 | 4,838.2 | 7,325.1 | 11,090.5 | 16,791.3 | 25,422.6 |
| Inventories, % | 26.84 | 98.84 | 36.65 | 16.4 | 10.19 | 37.78 | 37.78 | 37.78 | 37.78 | 37.78 |
| Accounts Payable | 72.1 | 77.9 | 247.8 | 280.0 | 1,036.3 | 1,299.8 | 1,968.0 | 2,979.6 | 4,511.2 | 6,830.2 |
| Accounts Payable, % | 10.31 | 15.76 | 7.93 | 4.5 | 12.25 | 10.15 | 10.15 | 10.15 | 10.15 | 10.15 |
| Capital Expenditure | -1.4 | -120.8 | -352.2 | -508.3 | -668.9 | -1,331.5 | -2,015.9 | -3,052.1 | -4,621.0 | -6,996.3 |
| Capital Expenditure, % | -0.19577 | -24.45 | -11.27 | -8.17 | -7.91 | -10.4 | -10.4 | -10.4 | -10.4 | -10.4 |
| Tax Rate, % | 25.36 | 25.36 | 25.36 | 25.36 | 25.36 | 25.36 | 25.36 | 25.36 | 25.36 | 25.36 |
| EBITAT | -84.2 | 64.5 | 397.7 | 831.6 | 936.8 | 1,051.7 | 1,592.3 | 2,410.8 | 3,650.1 | 5,526.3 |
| Depreciation | ||||||||||
| Changes in Account Receivables | ||||||||||
| Changes in Inventories | ||||||||||
| Changes in Accounts Payable | ||||||||||
| Capital Expenditure | ||||||||||
| UFCF | -566.8 | -60.9 | -610.8 | -705.2 | 82.2 | -4,676.8 | -3,819.1 | -5,782.2 | -8,754.5 | -13,254.6 |
| WACC, % | 8.17 | 8.14 | 8.17 | 8.18 | 8.17 | 8.17 | 8.17 | 8.17 | 8.17 | 8.17 |
| PV UFCF | ||||||||||
| SUM PV UFCF | -27,502.0 | |||||||||
| Long Term Growth Rate, % | 2.00 | |||||||||
| Free cash flow (T + 1) | -13,520 | |||||||||
| Terminal Value | -219,170 | |||||||||
| Present Terminal Value | -148,005 | |||||||||
| Enterprise Value | -175,507 | |||||||||
| Net Debt | -533 | |||||||||
| Equity Value | -174,974 | |||||||||
| Diluted Shares Outstanding, MM | 1,159 | |||||||||
| Equity Value Per Share | -150.99 |
What You Will Receive
- Accurate LLOYDSENGGNS Financials: Comprehensive historical and projected data for precise valuation.
- Customizable Parameters: Adjust WACC, tax rates, revenue growth, and capital expenditures to fit your needs.
- Real-Time Calculations: Instant assessment of intrinsic value and NPV based on your inputs.
- Scenario Analysis: Evaluate various scenarios to forecast Lloyds Engineering Works Limited’s future performance.
- User-Friendly Design: Designed for industry experts while remaining accessible to newcomers.
Key Features
- Customizable Forecast Inputs: Adjust essential metrics such as revenue growth, EBITDA %, and capital expenditures.
- Instant DCF Valuation: Quickly computes intrinsic value, NPV, and additional financial metrics.
- Industry-Leading Precision: Leverages Lloyds Engineering Works Limited's (LLOYDSENGGNS) actual financial data for accurate valuation results.
- Simplified Scenario Analysis: Effortlessly evaluate various assumptions and assess their impacts.
- Efficiency Booster: Remove the necessity of constructing intricate valuation models from the ground up.
How It Works
- Step 1: Download the ready-to-use Excel template that includes data for Lloyds Engineering Works Limited (LLOYDSENGGNS).
- Step 2: Explore the pre-filled sheets to familiarize yourself with the key performance indicators.
- Step 3: Modify forecasts and assumptions in the editable yellow cells (WACC, growth rates, profit margins).
- Step 4: Instantly see the updated results, including the intrinsic value of Lloyds Engineering Works Limited (LLOYDSENGGNS).
- Step 5: Utilize the outputs to make well-informed investment decisions or to create reports.
Why Opt for Lloyds Engineering Works Limited (LLOYDSENGGNS) Calculator?
- Time Efficient: Use our ready-made calculator without the hassle of building a model from the ground up.
- Enhanced Precision: Dependable financial metrics and calculations minimize valuation errors.
- Completely Customizable: Adjust the model to align with your unique assumptions and forecasts.
- Simple to Understand: Intuitive charts and outputs facilitate easy analysis of results.
- Endorsed by Professionals: Crafted for those who prioritize accuracy and ease of use.
Who Can Benefit from This Product?
- Engineering Students: Acquire hands-on experience with industry-standard practices and real-world data.
- Researchers: Integrate advanced engineering models into your studies or projects.
- Investors: Validate your investment hypotheses and evaluate project outcomes related to Lloyds Engineering Works Limited (LLOYDSENGGNS).
- Industry Analysts: Enhance your analysis with a customizable framework tailored for engineering projects.
- Small Business Owners: Understand the analytical approaches used by large engineering firms like Lloyds Engineering Works Limited (LLOYDSENGGNS).
Overview of the Template
- Operating and Balance Sheet Data: Pre-filled historical data and forecasts for Lloyds Engineering Works Limited (LLOYDSENGGNS), including revenue, EBITDA, EBIT, and capital expenditures.
- WACC Calculation: A dedicated sheet for calculating the Weighted Average Cost of Capital (WACC), featuring key parameters such as Beta, risk-free rate, and share price.
- DCF Valuation (Unlevered and Levered): Customizable Discounted Cash Flow models that detail intrinsic value with comprehensive calculations.
- Financial Statements: Pre-loaded financial statements (annual and quarterly) to facilitate thorough analysis.
- Key Ratios: A collection of profitability, leverage, and efficiency ratios relevant to Lloyds Engineering Works Limited (LLOYDSENGGNS).
- Dashboard and Charts: A visual representation of valuation outputs and assumptions, simplifying the analysis of results.
Disclaimer
All information, articles, and product details provided on this website are for general informational and educational purposes only. We do not claim any ownership over, nor do we intend to infringe upon, any trademarks, copyrights, logos, brand names, or other intellectual property mentioned or depicted on this site. Such intellectual property remains the property of its respective owners, and any references here are made solely for identification or informational purposes, without implying any affiliation, endorsement, or partnership.
We make no representations or warranties, express or implied, regarding the accuracy, completeness, or suitability of any content or products presented. Nothing on this website should be construed as legal, tax, investment, financial, medical, or other professional advice. In addition, no part of this site—including articles or product references—constitutes a solicitation, recommendation, endorsement, advertisement, or offer to buy or sell any securities, franchises, or other financial instruments, particularly in jurisdictions where such activity would be unlawful.
All content is of a general nature and may not address the specific circumstances of any individual or entity. It is not a substitute for professional advice or services. Any actions you take based on the information provided here are strictly at your own risk. You accept full responsibility for any decisions or outcomes arising from your use of this website and agree to release us from any liability in connection with your use of, or reliance upon, the content or products found herein.