
|
Landstar System, Inc. (LSTR): 5 forças Análise [Jan-2025 Atualizada] |
Totalmente Editável: Adapte-Se Às Suas Necessidades No Excel Ou Planilhas
Design Profissional: Modelos Confiáveis E Padrão Da Indústria
Pré-Construídos Para Uso Rápido E Eficiente
Compatível com MAC/PC, totalmente desbloqueado
Não É Necessária Experiência; Fácil De Seguir
Landstar System, Inc. (LSTR) Bundle
No mundo dinâmico da logística e transporte, a Landstar System, Inc. (LSTR) navega em uma paisagem competitiva complexa moldada pelas cinco forças de Michael Porter. Desde a intrincada dança das negociações de fornecedores até a pressão implacável das demandas dos clientes e as interrupções tecnológicas emergentes, essa análise revela os desafios e oportunidades estratégicas que definem o posicionamento competitivo de Landstar em 2024. Mergulhe profundamente nas forças que impulsionam a inovação, a eficiência e a sobrevivência em um das indústrias mais exigentes do nosso tempo.
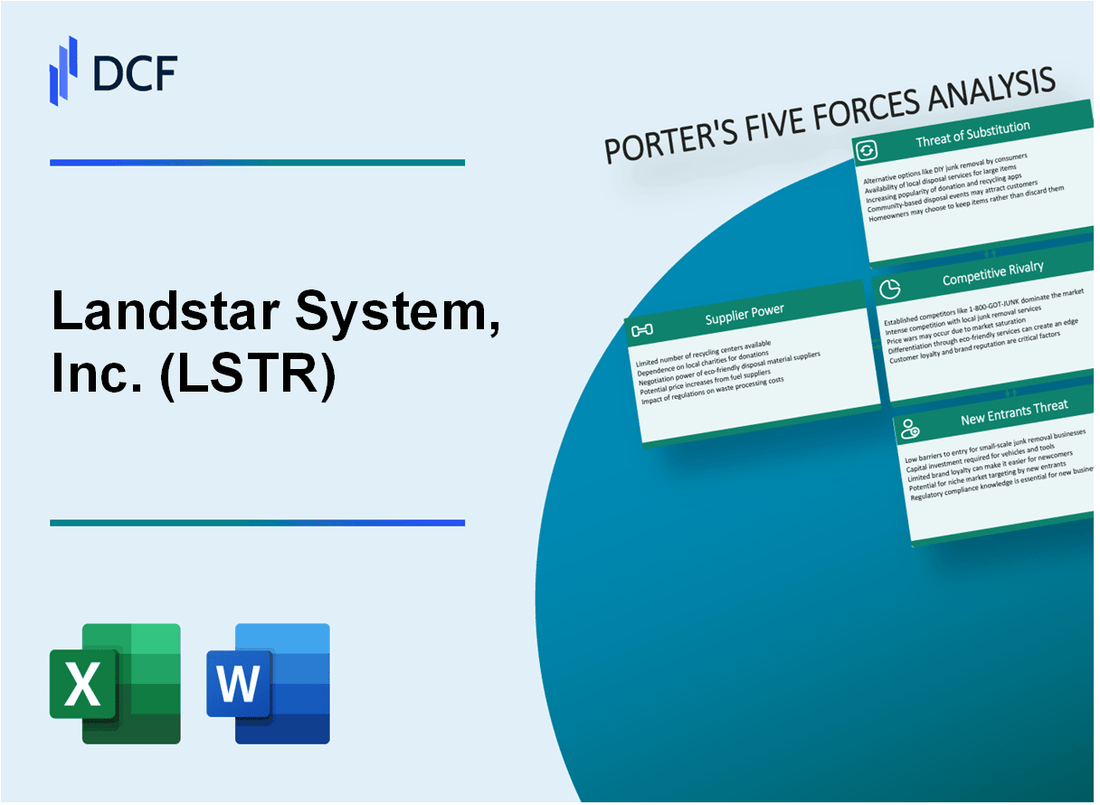
Landstar System, Inc. (LSTR) - As cinco forças de Porter: poder de barganha dos fornecedores
Número limitado de fabricantes de caminhões e fornecedores de reboques
A partir de 2024, o mercado de fabricação de caminhões é dominado por alguns participantes importantes:
| Fabricante | Quota de mercado |
|---|---|
| Daimler Trucks North America | 37.2% |
| Paccar Inc. | 28.5% |
| Grupo Volvo | 22.3% |
| Navistar International | 12% |
Dependência de contratados independentes e proprietários-operadores
A rede de Landstar compreende:
- Aproximadamente 13.500 contratados independentes
- Mais de 1.000 provedores de capacidade de terceiros
- 98% da capacidade de transporte da Landstar proveniente de contratados independentes
Fornecedores de combustível poder de precificação
Indicadores atuais de preços de combustível:
| Tipo de combustível | Preço médio por galão | Volatilidade anual |
|---|---|---|
| Diesel | $4.15 | ±12.3% |
| Gasolina | $3.85 | ±10.7% |
Provedores de tecnologia e equipamentos
Os principais fornecedores de tecnologia para Landstar:
- McLeod Software - Sistemas de Gerenciamento de Transporte
- Omnitracs - Tecnologia de rastreamento e comunicação
- Trimble Transportation - Logistics Software Solutions
Custos de troca de fornecedores
Custos de troca estimados para fornecedores críticos:
| Categoria de fornecedores | Comutação de complexidade de custo | Custo estimado de transição |
|---|---|---|
| Fabricantes de caminhões | Alto | $250,000 - $500,000 |
| Provedores de tecnologia | Moderado | $75,000 - $150,000 |
| Fornecedores de combustível | Baixo | $10,000 - $25,000 |
Landstar System, Inc. (LSTR) - As cinco forças de Porter: poder de barganha dos clientes
Base de clientes diversificados em vários setores
A Landstar System, Inc. atende clientes em 11 verticais da indústria primária a partir de 2023, incluindo:
- Construção
- Fabricação
- Automotivo
- Energia
- Varejo
Concentração do cliente e distribuição de receita
| Segmento de clientes | Porcentagem de receita |
|---|---|
| 10 principais clientes | 15.2% |
| Maior cliente único | 2.7% |
Sensibilidade ao preço e negociação de taxa
Os dados financeiros de 2022 de Landstar revelam:
- Duração média do contrato: 12-18 meses
- Flutuação da taxa de mercado à vista: ± 22%
- Negociações da taxa de clientes da empresa: até 15% de desconto potencial
Alternativas do provedor de serviços de transporte
| Categoria de concorrentes | Número de provedores |
|---|---|
| Transportadoras nacionais de carga | 37 |
| Serviços de transporte regional | 126 |
Requisitos de flexibilidade do cliente
Principais métricas de demanda de clientes para 2023:
- Rastreamento em tempo real: 94% dos clientes
- Soluções de transporte multimodal: 68%
- Requisito de integração digital: 82%
Landstar System, Inc. (LSTR) - As cinco forças de Porter: rivalidade competitiva
Cenário competitivo da indústria
Tamanho do mercado de transporte e logística dos EUA: US $ 1,096 trilhão em 2023. Segmento da indústria de caminhões: US $ 242,4 bilhões.
| Principais concorrentes | Receita anual (2023) | Quota de mercado |
|---|---|---|
| CH Robinson em todo o mundo | US $ 23,4 bilhões | 6.2% |
| XPO Logistics | US $ 13,2 bilhões | 3.8% |
| J.B. Hunt Transport Services | US $ 9,6 bilhões | 2.9% |
| Landstar System, Inc. | US $ 5,8 bilhões | 1.7% |
Dinâmica competitiva
O posicionamento competitivo de Landstar reflete intenso concorrência no mercado:
- Número de corretores de carga nos EUA: 18.457
- Operadores de caminhões independentes: 3,36 milhões
- Transportadores de caminhão: 1,2 milhão
Investimento em tecnologia
O investimento em tecnologia da Landstar em 2023: US $ 47,3 milhões, representando 0,82% da receita anual.
| Foco em tecnologia | Valor do investimento |
|---|---|
| Aprimoramento da plataforma digital | US $ 22,1 milhões |
| Atualizações de software de logística | US $ 15,6 milhões |
| Melhorias de segurança cibernética | US $ 9,6 milhões |
Métricas de concorrência de preços
Taxas médias de comissão de corretagem de frete: 15-20% do valor total da remessa.
- Taxa média de comissão de Landstar: 17,3%
- Taxas médias de mercado médias da indústria: US $ 2,53 por milha
- Taxas de frete contrato: US $ 2,35 por milha
Landstar System, Inc. (LSTR) - As cinco forças de Porter: ameaça de substitutos
Modos de transporte alternativos
A partir de 2024, o tamanho do mercado de frete ferroviário: US $ 241,4 bilhões. Volume do mercado de frete aéreo: 69,3 milhões de toneladas. Participação de mercado de caminhões para Landstar: 15,2% do transporte total de carga.
| Modo de transporte | Quota de mercado (%) | Receita anual ($ B) |
|---|---|---|
| Frete de caminhão | 68.3% | 397.6 |
| Frete ferroviário | 22.7% | 241.4 |
| Frete aéreo | 5.9% | 86.2 |
Plataformas de correspondência de frete digital
Plataformas de frete digital Valor de mercado: US $ 7,68 bilhões em 2024. Taxa de crescimento projetada: 32,4% anualmente.
- Participação de mercado da Uber Freight: 3,6%
- Transações da plataforma de comboio: 1,2 milhão de cargas anualmente
- Taxa de adoção da plataforma de frete digital: 27,5% do mercado total de frete
Soluções de logística interna
Grandes empresas com logística interna: 42,3% das empresas da Fortune 500. Economia média anual de custos logísticos: US $ 18,7 milhões por corporação.
Serviços de transporte intermodal
Tamanho do mercado de transporte intermodal: US $ 92,3 bilhões em 2024. Taxa de crescimento anual: 6,7%.
| Segmento intermodal | Volume de mercado | Crescimento anual |
|---|---|---|
| Transporte de contêineres | 47,6 milhões de teus | 5.9% |
| Transporte de reboque | 3,2 milhões de unidades | 4.3% |
Transporte autônomo e elétrico
Projeção autônoma do mercado de caminhões: US $ 2,16 bilhões até 2024. Tamanho do mercado de caminhões elétricos: US $ 1,89 bilhão. Taxa de adoção: 4,7% da frota total de caminhões.
- Tesla semi -produção: 5.000 unidades planejadas
- Tusimple Miles autônomos: 2,1 milhões de milhas testadas
- Penetração do mercado de caminhões elétricos: 3,2%
Landstar System, Inc. (LSTR) - As cinco forças de Porter: ameaça de novos participantes
Altos requisitos de capital inicial para infraestrutura logística
O sistema Landstar requer investimento inicial substancial. Em 2023, o total de ativos da empresa era de US $ 2,1 bilhões, com propriedades e equipamentos avaliados em US $ 157,4 milhões. Os novos participantes precisariam replicar essa infraestrutura, que exige recursos financeiros significativos.
| Categoria de investimento de capital | Faixa de custo estimada |
|---|---|
| Frota de transporte | US $ 50-150 milhões |
| Infraestrutura de tecnologia | US $ 10-30 milhões |
| Software operacional | US $ 5-15 milhões |
Ambiente regulatório complexo na indústria de transporte
O setor de transporte envolve extensa conformidade regulatória. As principais barreiras incluem:
- Administração Federal de Segurança da Transportadora Motor (FMCSA) Custos de licenciamento: US $ 300 a US $ 700 por aplicativo
- Requisitos de seguro comercial: US $ 750.000 a US $ 1.000.000 de cobertura de responsabilidade mínima
- Custos anuais de conformidade com pontos: US $ 15.000 a US $ 50.000 por transportadora
Extensa rede de operadoras e contratados
Landstar gerencia 68.000 empreiteiros independentes e provedores de capacidade em 2023. A replicação dessa rede exige:
- 5-7 anos para desenvolver relacionamentos abrangentes da transportadora
- Despesas significativas de recrutamento e verificação
- Infraestrutura de gerenciamento de relacionamento contínuo
Investimento tecnológico significativo
Os investimentos em tecnologia são críticos para operações competitivas. As despesas tecnológicas da Landstar em 2023 foram de aproximadamente US $ 45,2 milhões, cobrindo:
| Área de investimento em tecnologia | Gastos anuais |
|---|---|
| Desenvolvimento da plataforma digital | US $ 18,5 milhões |
| Sistemas de gerenciamento de logística | US $ 12,7 milhões |
| Infraestrutura de segurança cibernética | US $ 14 milhões |
Reputação e relacionamentos estabelecidos da marca
A reputação do mercado de Landstar representa uma barreira de entrada significativa. A receita de 2023 da empresa atingiu US $ 5,2 bilhões, com um histórico de 15 anos de desempenho consistente na logística de transporte.
Landstar System, Inc. (LSTR) - Porter's Five Forces: Competitive rivalry
You're looking at a market where the sheer number of players makes every pricing decision a high-stakes game. The logistics industry remains defintely fragmented, which is the core driver of intense competitive rivalry for Landstar System, Inc. This fragmentation isn't just about size; it's about process. For instance, dispatchers in the broader sector spend up to 25% of their time re-entering shipment data across disconnected platforms, showing a systemic inefficiency that Landstar's asset-light model must constantly fight against or exploit.
Landstar System, Inc. competes directly against established giants and other major third-party logistics providers (3PLs). Key rivals include J.B. Hunt Transport Services, Inc., C.H. Robinson, and ArcBest. To gauge the scale difference, look at the top-line revenue figures reported near the end of 2025. J.B. Hunt Transport Services, Inc. reported second-quarter 2025 revenue of $2.93 billion. ArcBest's trailing twelve-month revenue as of 2025 was $4.03 Billion USD. For context on brokerage scale, C.H. Robinson reported 2024 Gross Logistics Revenue of $16,848 Million USD. While Landstar System, Inc. was ranked #24 among U.S. 3PLs by total 2023 logistics gross revenue/turnover, its competitive edge isn't pure size, but its specific network structure.
Pricing pressure is a constant headwind in this environment. We saw this squeeze Landstar System, Inc.'s profitability metrics in the middle of the year. Specifically, Landstar's variable contribution margin-which is revenue left after paying for purchased transportation and agent commissions-compressed slightly to 14.1% of revenue in the second quarter of 2025, down from 14.3% year-over-year. This compression signals that the cost of capacity, relative to the rates Landstar could charge customers, tightened a bit.
However, Landstar System, Inc. successfully differentiates itself by focusing on specialized freight, which commands better pricing power. This is where the rivalry is less about the lowest common denominator rate. The heavy haul segment, which falls under services hauled by unsided/platform equipment, is a prime example of this successful differentiation. For the third quarter of 2025, this specialized service saw impressive revenue growth of 17% year-over-year, reaching approximately $147 million, up from about $125.6 million in the third quarter of 2024. This strength in specialized, high-value freight helps offset broader market softness.
Landstar System, Inc.'s scale, built on its asset-light model utilizing a vast network of independent business capacity owners (BCOs) and agents, provides a structural advantage over asset-heavy carriers when capacity is tight or specialized needs arise. The network included approximately 1,100 agents and more than 85,600 capacity providers as of mid-2024. This structure allows for variable cost scaling that asset-heavy competitors cannot easily match.
Here's a quick look at the scale comparison among the key trucking-focused rivals based on recent figures:
| Company | Latest Reported Revenue Metric (Approximate) | Period |
|---|---|---|
| J.B. Hunt Transport Services, Inc. | $2.93 billion | Q2 2025 Revenue |
| ArcBest | $4.03 Billion USD | TTM 2025 Revenue |
| C.H. Robinson | $16,848 Million USD | 2024 Gross Logistics Revenue |
| Landstar System, Inc. (LSTR) | 14.1% | Q2 2025 Variable Contribution Margin |
The competitive landscape forces Landstar System, Inc. to maintain operational excellence in niche areas while managing margin erosion in the more commoditized segments. You see this tension clearly in the performance metrics:
- Pricing pressure compressed Q2 2025 VCM to 14.1% from 14.3% YoY.
- Specialized heavy haul revenue grew 17% in Q3 2025.
- BCO truck count achieved sequential growth for the first time since Q1 2022 in Q3 2025.
- Revenue hauled on behalf of other truck transportation companies in Q3 2025 was 17% below Q3 2024, indicating capacity was readily accessible to the broader market.
Finance: draft 13-week cash view by Friday.
Landstar System, Inc. (LSTR) - Porter's Five Forces: Threat of substitutes
You're assessing the competitive landscape for Landstar System, Inc., and the threat of substitutes is a key area where the asset-light model meets external competition. The substitutes here are fundamentally different modes of transport that can handle freight, plus new digital intermediaries that change how capacity is sourced.
Substitutes include other modes of transport like rail intermodal, air cargo, and ocean freight. For Landstar System, Inc., these modes historically represent a minor part of the overall revenue pie, which is dominated by truck transportation services. Looking at the fiscal year 2024 results, the contribution from these alternative modes was relatively small, showing the core business strength in truck-based logistics.
Here's a quick look at the revenue contribution from these other modes in fiscal year 2024, based on Landstar System, Inc.'s filings:
| Mode of Transport Substitute | Revenue Contribution (Fiscal Year 2024) |
| Rail Intermodal Services | 2% of consolidated revenue |
| Air and Ocean Cargo Carriers (Collectively) | 6% of consolidated revenue |
| Total Rail, Air, and Ocean (Collective Estimate) | 8% of consolidated revenue (2% + 6%) |
So, while these modes exist as alternatives, they collectively accounted for about 8% of Landstar System, Inc.'s consolidated revenue in fiscal year 2024, leaving the vast majority of business exposed to truck-based competition. Still, for specific lanes or cargo types, customers have clear options to pivot.
Customers can pivot to asset-heavy carriers, which might offer more dedicated control, or they can choose to develop in-house logistics capabilities, effectively taking that volume away from all third-party providers. Landstar System, Inc. counters this by leveraging its massive network of over 78,000 third-party capacity providers, which allows it to maintain lower fixed costs and a higher return on invested capital compared to asset-heavy competitors.
The most dynamic threat comes from digital freight brokers, which are a growing substitute offering instant, low-touch capacity matching. This technology-driven approach directly challenges the agent-centric, relationship-based model Landstar System, Inc. relies upon. The market for these digital solutions is expanding rapidly, indicating increasing customer comfort with automated platforms:
- The global digital freight brokerage market size was valued at approximately $5.9 billion in 2024.
- This market is projected to grow to $7.51 billion in 2025.
- The projected Compound Annual Growth Rate (CAGR) from 2025 to 2034 is around 27.34%.
- The North America market size was estimated at $2.54 billion in 2024.
Landstar System, Inc. is definitely responding by investing in its own AI-enabled digital tools to support its agents and capacity providers.
Landstar System, Inc. (LSTR) - Porter's Five Forces: Threat of new entrants
You're looking at the barriers to entry for Landstar System, Inc., and honestly, it's a mixed bag. The asset-light model, which Landstar champions, inherently lowers the initial capital hurdle compared to asset-heavy competitors who must buy millions in tractors and trailers. A new entrant doesn't need to immediately acquire a fleet, which is a plus for starting up.
Still, replicating Landstar's established ecosystem is a massive time sink. You can't just buy a network; you have to build it. Landstar's structure relies on a deep bench of capacity providers and agents. They report a network of over 1,000 agents, and the outline suggests they leverage 88,000+ capacity providers. Building that trust and volume takes years, which acts as a significant, time-intensive barrier to entry for any newcomer.
New entrants also struggle to match the sheer scale and the network effect baked into Landstar's proprietary technology platform. When you're moving $1,205 million in revenue in a single quarter, like Landstar did in Q3 2025, that volume gives you leverage and data insights that a startup simply won't have access to early on. The more agents and capacity providers they have, the better the service, which attracts more customers-that's the network effect working for them.
Regulatory hurdles and the need for a strong safety/security reputation, especially in specialized freight, present high barriers. Carriers must navigate complex compliance. For Landstar, managing risk is visible in their costs; for instance, insurance and claims costs hit 7.2% of BCO revenue in Q3 2025. A new, unproven entrant will face much higher initial insurance premiums or struggle to secure the necessary coverage for high-value or specialized loads, which is a major deterrent for shippers.
Here's a quick look at some of the scale and cost metrics that define the current landscape:
| Metric | Landstar System, Inc. (LSTR) Value | Industry Context/Date |
|---|---|---|
| Agent Network Size | Approximately 1,050 | As of Q1 2025 data |
| Reported Q3 2025 Revenue | $1,205 million | For the third quarter of 2025 |
| Insurance & Claims Cost (% of BCO Revenue) | 7.2% | Q3 2025 |
| Active US Motor Carriers | Almost 580,000 | As of June 2025 |
| US Truck Drivers | 3.54 million | 2025 data |
The threat isn't zero, but it's concentrated. New entrants are more likely to be small operations targeting niche lanes rather than direct competitors to Landstar's broad platform.
- Most US motor carriers (91.5%) operate 10 or fewer trucks as of June 2025.
- Landstar's SG&A costs were $57 million in Q3 2025.
- The US trucking market size was valued at $217.3 billion in 2023.
Finance: draft 13-week cash view by Friday.
Disclaimer
All information, articles, and product details provided on this website are for general informational and educational purposes only. We do not claim any ownership over, nor do we intend to infringe upon, any trademarks, copyrights, logos, brand names, or other intellectual property mentioned or depicted on this site. Such intellectual property remains the property of its respective owners, and any references here are made solely for identification or informational purposes, without implying any affiliation, endorsement, or partnership.
We make no representations or warranties, express or implied, regarding the accuracy, completeness, or suitability of any content or products presented. Nothing on this website should be construed as legal, tax, investment, financial, medical, or other professional advice. In addition, no part of this site—including articles or product references—constitutes a solicitation, recommendation, endorsement, advertisement, or offer to buy or sell any securities, franchises, or other financial instruments, particularly in jurisdictions where such activity would be unlawful.
All content is of a general nature and may not address the specific circumstances of any individual or entity. It is not a substitute for professional advice or services. Any actions you take based on the information provided here are strictly at your own risk. You accept full responsibility for any decisions or outcomes arising from your use of this website and agree to release us from any liability in connection with your use of, or reliance upon, the content or products found herein.