
|
Life Time Group Holdings, Inc. (LTH) Avaliação DCF |
Totalmente Editável: Adapte-Se Às Suas Necessidades No Excel Ou Planilhas
Design Profissional: Modelos Confiáveis E Padrão Da Indústria
Pré-Construídos Para Uso Rápido E Eficiente
Compatível com MAC/PC, totalmente desbloqueado
Não É Necessária Experiência; Fácil De Seguir
Life Time Group Holdings, Inc. (LTH) Bundle
Simplifique sua análise e melhore a precisão com a nossa calculadora [símbolo] DCF! Utilizando dados reais da Life Time Group Holdings, Inc. e suposições personalizáveis, essa ferramenta o capacita a prever, avaliar e valorizar [Empresa] como um investidor experiente.
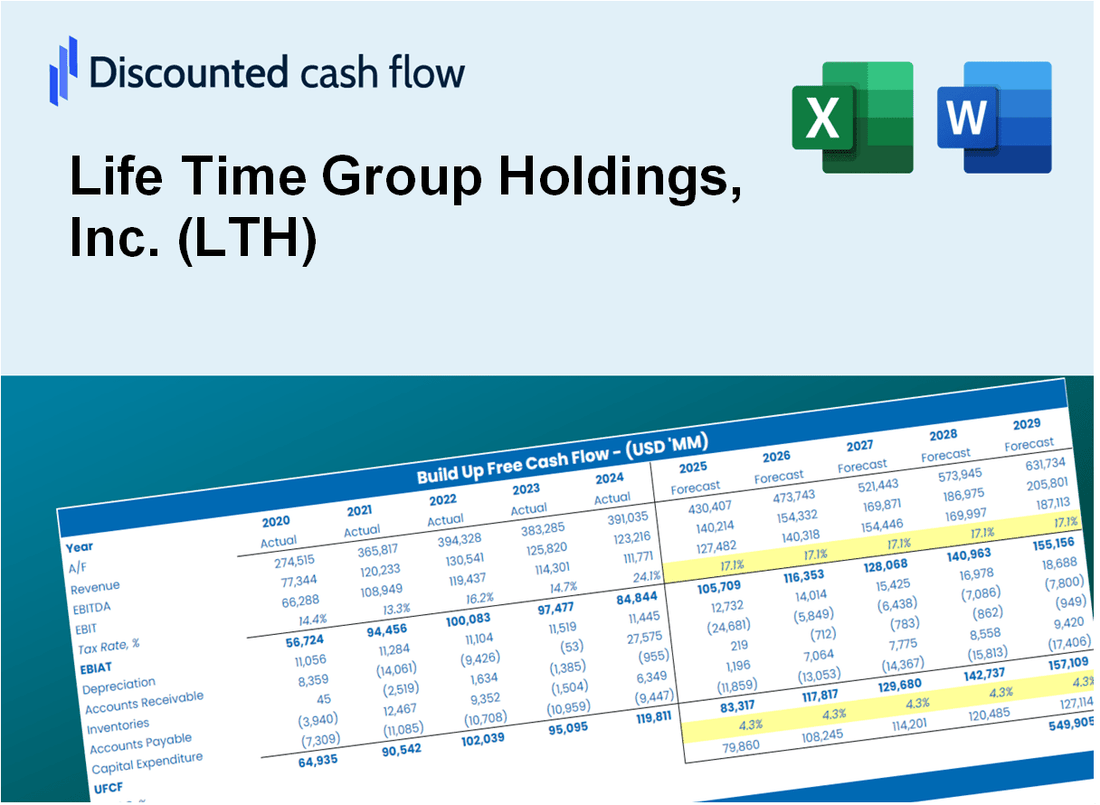
Discounted Cash Flow (DCF) - (USD MM)
| Year | AY1 2020 |
AY2 2021 |
AY3 2022 |
AY4 2023 |
AY5 2024 |
FY1 2025 |
FY2 2026 |
FY3 2027 |
FY4 2028 |
FY5 2029 |
|---|---|---|---|---|---|---|---|---|---|---|
| Revenue | 948.4 | 1,318.1 | 1,822.6 | 2,216.6 | 2,621.0 | 3,388.4 | 4,380.6 | 5,663.2 | 7,321.4 | 9,465.1 |
| Revenue Growth, % | 0 | 38.98 | 38.28 | 21.62 | 18.24 | 29.28 | 29.28 | 29.28 | 29.28 | 29.28 |
| EBITDA | -111.6 | -260.1 | 339.5 | 470.0 | 632.2 | 219.9 | 284.3 | 367.5 | 475.1 | 614.2 |
| EBITDA, % | -11.77 | -19.73 | 18.63 | 21.2 | 24.12 | 6.49 | 6.49 | 6.49 | 6.49 | 6.49 |
| Depreciation | 247.7 | 235.1 | 228.9 | 244.4 | 274.7 | 528.7 | 683.5 | 883.7 | 1,142.4 | 1,476.9 |
| Depreciation, % | 26.12 | 17.84 | 12.56 | 11.03 | 10.48 | 15.6 | 15.6 | 15.6 | 15.6 | 15.6 |
| EBIT | -359.3 | -495.2 | 110.6 | 225.6 | 357.5 | -308.8 | -399.3 | -516.2 | -667.3 | -862.7 |
| EBIT, % | -37.89 | -37.57 | 6.07 | 10.18 | 13.64 | -9.11 | -9.11 | -9.11 | -9.11 | -9.11 |
| Total Cash | 33.2 | 31.6 | 25.5 | 30.0 | 27.9 | 65.8 | 85.1 | 110.0 | 142.3 | 183.9 |
| Total Cash, percent | .0 | .0 | .0 | .0 | .0 | .0 | .0 | .0 | .0 | .0 |
| Account Receivables | 21.4 | 24.9 | 23.0 | 59.3 | 38.5 | 64.7 | 83.7 | 108.2 | 139.9 | 180.9 |
| Account Receivables, % | 2.26 | 1.89 | 1.26 | 2.67 | 1.47 | 1.91 | 1.91 | 1.91 | 1.91 | 1.91 |
| Inventories | 36.3 | 41.0 | 45.7 | 52.8 | 60.3 | 95.7 | 123.7 | 160.0 | 206.8 | 267.3 |
| Inventories, % | 3.83 | 3.11 | 2.5 | 2.38 | 2.3 | 2.82 | 2.82 | 2.82 | 2.82 | 2.82 |
| Accounts Payable | 54.1 | 71.3 | 74.0 | 81.3 | 87.8 | 150.4 | 194.4 | 251.3 | 324.9 | 420.1 |
| Accounts Payable, % | 5.7 | 5.41 | 4.06 | 3.67 | 3.35 | 4.44 | 4.44 | 4.44 | 4.44 | 4.44 |
| Capital Expenditure | -265.6 | -328.9 | -591.2 | -693.9 | -524.5 | -926.5 | -1,197.8 | -1,548.5 | -2,001.9 | -2,588.1 |
| Capital Expenditure, % | -28.01 | -24.95 | -32.44 | -31.3 | -20.01 | -27.34 | -27.34 | -27.34 | -27.34 | -27.34 |
| Tax Rate, % | 25.16 | 25.16 | 25.16 | 25.16 | 25.16 | 25.16 | 25.16 | 25.16 | 25.16 | 25.16 |
| EBITAT | -265.4 | -398.6 | 75.8 | 181.0 | 267.5 | -233.4 | -301.8 | -390.2 | -504.4 | -652.1 |
| Depreciation | ||||||||||
| Changes in Account Receivables | ||||||||||
| Changes in Inventories | ||||||||||
| Changes in Accounts Payable | ||||||||||
| Capital Expenditure | ||||||||||
| UFCF | -286.9 | -483.5 | -286.6 | -304.6 | 37.5 | -630.3 | -819.0 | -1,058.8 | -1,368.8 | -1,769.6 |
| WACC, % | 7.85 | 7.95 | 7.76 | 7.95 | 7.86 | 7.87 | 7.87 | 7.87 | 7.87 | 7.87 |
| PV UFCF | ||||||||||
| SUM PV UFCF | -4,353.7 | |||||||||
| Long Term Growth Rate, % | 4.00 | |||||||||
| Free cash flow (T + 1) | -1,840 | |||||||||
| Terminal Value | -47,500 | |||||||||
| Present Terminal Value | -32,516 | |||||||||
| Enterprise Value | -36,870 | |||||||||
| Net Debt | 3,976 | |||||||||
| Equity Value | -40,846 | |||||||||
| Diluted Shares Outstanding, MM | 211 | |||||||||
| Equity Value Per Share | -193.43 |
What You Will Get
- Editable Forecast Inputs: Effortlessly adjust key assumptions (growth %, margins, WACC) to explore various scenarios.
- Real-World Data: Life Time Group Holdings, Inc. (LTH) financial data pre-loaded to facilitate your analysis.
- Automatic DCF Outputs: The template computes Net Present Value (NPV) and intrinsic value automatically.
- Customizable and Professional: A sleek Excel model tailored to meet your valuation requirements.
- Built for Analysts and Investors: Perfect for evaluating projections, validating strategies, and enhancing efficiency.
Key Features
- Comprehensive Financial Data: Gain access to precise historical performance and future forecasts for Life Time Group Holdings, Inc. (LTH).
- Adjustable Forecast Parameters: Modify highlighted fields such as WACC, growth rates, and profit margins to suit your analysis.
- Automated Calculations: Real-time updates for DCF, Net Present Value (NPV), and cash flow assessments.
- Interactive Dashboard: User-friendly charts and summaries to effectively visualize your valuation outcomes.
- Designed for All Skill Levels: A clear, intuitive layout tailored for investors, CFOs, and consultants alike.
How It Works
- 1. Access the Template: Download and open the Excel file containing Life Time Group Holdings, Inc. (LTH) preloaded data.
- 2. Adjust Key Inputs: Modify critical assumptions such as growth rates, WACC, and capital expenditures.
- 3. Analyze Results Immediately: The DCF model automatically computes intrinsic value and NPV in real-time.
- 4. Explore Different Scenarios: Evaluate various forecasts to assess different valuation possibilities.
- 5. Present with Assurance: Deliver professional valuation insights to reinforce your strategic decisions.
Why Choose This Calculator for Life Time Group Holdings, Inc. (LTH)?
- Accuracy: Utilizes authentic Life Time financials to ensure precise data.
- Flexibility: Built for users to easily experiment and adjust inputs as needed.
- Time-Saving: Avoid the complexities of creating a DCF model from the ground up.
- Professional-Grade: Crafted with the expertise and usability expected by CFOs.
- User-Friendly: Intuitive design makes it accessible for users with varying levels of financial modeling experience.
Who Should Use This Product?
- Investors: Accurately assess Life Time Group Holdings, Inc.'s (LTH) fair value prior to making investment choices.
- CFOs: Utilize a high-quality DCF model for comprehensive financial reporting and analysis.
- Consultants: Easily modify the template for client valuation reports.
- Entrepreneurs: Acquire insights into financial modeling practices employed by leading companies.
- Educators: Implement it as a teaching resource to illustrate valuation techniques.
What the Template Contains
- Pre-Filled Data: Includes Life Time Group Holdings, Inc.'s (LTH) historical financials and projections.
- Discounted Cash Flow Model: Editable DCF valuation model featuring automatic calculations.
- Weighted Average Cost of Capital (WACC): A dedicated sheet for calculating WACC based on user-defined inputs.
- Key Financial Ratios: Assess Life Time Group Holdings, Inc.'s (LTH) profitability, efficiency, and leverage metrics.
- Customizable Inputs: Easily modify revenue growth, profit margins, and tax rates.
- Clear Dashboard: Visualizations and tables summarizing essential valuation outcomes.
Disclaimer
All information, articles, and product details provided on this website are for general informational and educational purposes only. We do not claim any ownership over, nor do we intend to infringe upon, any trademarks, copyrights, logos, brand names, or other intellectual property mentioned or depicted on this site. Such intellectual property remains the property of its respective owners, and any references here are made solely for identification or informational purposes, without implying any affiliation, endorsement, or partnership.
We make no representations or warranties, express or implied, regarding the accuracy, completeness, or suitability of any content or products presented. Nothing on this website should be construed as legal, tax, investment, financial, medical, or other professional advice. In addition, no part of this site—including articles or product references—constitutes a solicitation, recommendation, endorsement, advertisement, or offer to buy or sell any securities, franchises, or other financial instruments, particularly in jurisdictions where such activity would be unlawful.
All content is of a general nature and may not address the specific circumstances of any individual or entity. It is not a substitute for professional advice or services. Any actions you take based on the information provided here are strictly at your own risk. You accept full responsibility for any decisions or outcomes arising from your use of this website and agree to release us from any liability in connection with your use of, or reliance upon, the content or products found herein.