
|
Avaliação DCF Lifeway Foods, Inc. (Lway) |
Totalmente Editável: Adapte-Se Às Suas Necessidades No Excel Ou Planilhas
Design Profissional: Modelos Confiáveis E Padrão Da Indústria
Pré-Construídos Para Uso Rápido E Eficiente
Compatível com MAC/PC, totalmente desbloqueado
Não É Necessária Experiência; Fácil De Seguir
Lifeway Foods, Inc. (LWAY) Bundle
Aprimore sua estratégia de investimento com a calculadora DCF (Lway)! Explore os autênticos alimentos da vida financeira, ajustam as previsões e despesas do crescimento e observe instantaneamente como essas alterações afetam o valor intrínseco de (Lway).
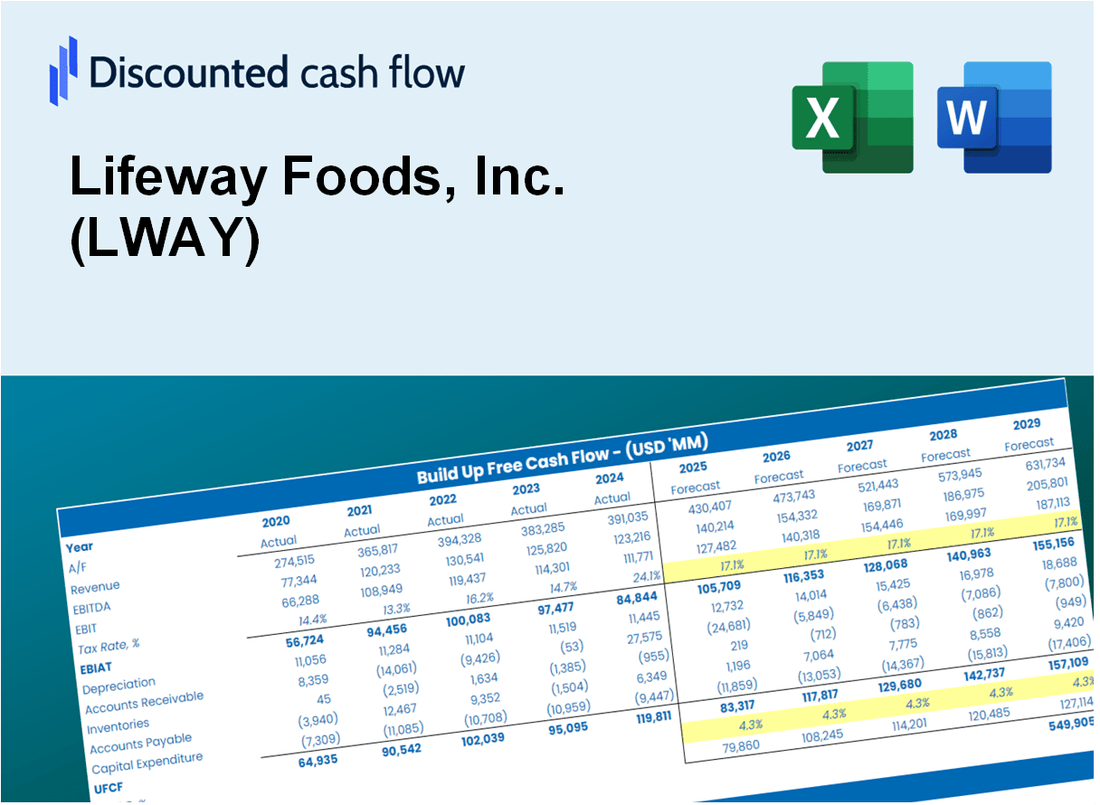
Discounted Cash Flow (DCF) - (USD MM)
| Year | AY1 2020 |
AY2 2021 |
AY3 2022 |
AY4 2023 |
AY5 2024 |
FY1 2025 |
FY2 2026 |
FY3 2027 |
FY4 2028 |
FY5 2029 |
|---|---|---|---|---|---|---|---|---|---|---|
| Revenue | 102.0 | 119.1 | 141.6 | 160.1 | 186.8 | 217.4 | 252.9 | 294.2 | 342.3 | 398.3 |
| Revenue Growth, % | 0 | 16.7 | 18.9 | 13.11 | 16.67 | 16.34 | 16.34 | 16.34 | 16.34 | 16.34 |
| EBITDA | 8.2 | 8.6 | 5.1 | 20.2 | 17.5 | 17.7 | 20.6 | 24.0 | 27.9 | 32.5 |
| EBITDA, % | 8.02 | 7.23 | 3.59 | 12.61 | 9.35 | 8.16 | 8.16 | 8.16 | 8.16 | 8.16 |
| Depreciation | 3.2 | 2.9 | 3.0 | 3.2 | 3.4 | 5.0 | 5.8 | 6.8 | 7.9 | 9.1 |
| Depreciation, % | 3.17 | 2.41 | 2.1 | 1.97 | 1.81 | 2.29 | 2.29 | 2.29 | 2.29 | 2.29 |
| EBIT | 4.9 | 5.7 | 2.1 | 17.0 | 14.1 | 12.7 | 14.8 | 17.3 | 20.1 | 23.4 |
| EBIT, % | 4.85 | 4.81 | 1.49 | 10.64 | 7.53 | 5.86 | 5.86 | 5.86 | 5.86 | 5.86 |
| Total Cash | 7.9 | 9.2 | 4.4 | 13.2 | 16.7 | 15.6 | 18.1 | 21.1 | 24.5 | 28.6 |
| Total Cash, percent | .0 | .0 | .0 | .0 | .0 | .0 | .0 | .0 | .0 | .0 |
| Account Receivables | 8.0 | 10.3 | 11.5 | 13.9 | 16.1 | 18.2 | 21.2 | 24.6 | 28.7 | 33.3 |
| Account Receivables, % | 7.87 | 8.63 | 8.09 | 8.67 | 8.59 | 8.37 | 8.37 | 8.37 | 8.37 | 8.37 |
| Inventories | 6.9 | 8.3 | 9.6 | 9.1 | 8.7 | 13.4 | 15.6 | 18.2 | 21.1 | 24.6 |
| Inventories, % | 6.79 | 6.96 | 6.8 | 5.69 | 4.65 | 6.18 | 6.18 | 6.18 | 6.18 | 6.18 |
| Accounts Payable | 5.6 | 6.6 | 8.0 | 10.0 | 10.4 | 12.4 | 14.4 | 16.8 | 19.5 | 22.7 |
| Accounts Payable, % | 5.48 | 5.55 | 5.64 | 6.23 | 5.57 | 5.69 | 5.69 | 5.69 | 5.69 | 5.69 |
| Capital Expenditure | -1.9 | -1.9 | -3.4 | -4.4 | -6.7 | -5.3 | -6.2 | -7.2 | -8.4 | -9.7 |
| Capital Expenditure, % | -1.86 | -1.61 | -2.44 | -2.72 | -3.58 | -2.44 | -2.44 | -2.44 | -2.44 | -2.44 |
| Tax Rate, % | 35.39 | 35.39 | 35.39 | 35.39 | 35.39 | 35.39 | 35.39 | 35.39 | 35.39 | 35.39 |
| EBITAT | 3.3 | 3.4 | 1.1 | 11.6 | 9.1 | 7.9 | 9.2 | 10.7 | 12.4 | 14.4 |
| Depreciation | ||||||||||
| Changes in Account Receivables | ||||||||||
| Changes in Inventories | ||||||||||
| Changes in Accounts Payable | ||||||||||
| Capital Expenditure | ||||||||||
| UFCF | -4.7 | 1.8 | -.6 | 10.5 | 4.5 | 2.6 | 5.6 | 6.6 | 7.6 | 8.9 |
| WACC, % | 5.84 | 5.83 | 5.83 | 5.84 | 5.84 | 5.84 | 5.84 | 5.84 | 5.84 | 5.84 |
| PV UFCF | ||||||||||
| SUM PV UFCF | 25.9 | |||||||||
| Long Term Growth Rate, % | 3.50 | |||||||||
| Free cash flow (T + 1) | 9 | |||||||||
| Terminal Value | 394 | |||||||||
| Present Terminal Value | 297 | |||||||||
| Enterprise Value | 323 | |||||||||
| Net Debt | -17 | |||||||||
| Equity Value | 339 | |||||||||
| Diluted Shares Outstanding, MM | 15 | |||||||||
| Equity Value Per Share | 22.22 |
What You Will Get
- Editable Excel Template: A fully customizable Excel-based DCF Calculator featuring pre-filled real LWAY financials.
- Real-World Data: Historical data and forward-looking estimates (as indicated in the yellow cells).
- Forecast Flexibility: Adjust forecast assumptions such as revenue growth, EBITDA %, and WACC.
- Automatic Calculations: Instantly observe the effects of your inputs on Lifeway Foods’ valuation.
- Professional Tool: Designed for investors, CFOs, consultants, and financial analysts.
- User-Friendly Design: Organized for clarity and ease of use, complete with step-by-step instructions.
Key Features
- Comprehensive Data: Lifeway Foods’ historical financial records and pre-populated forecasts.
- Customizable Inputs: Adjust WACC, tax rates, revenue growth, and EBITDA margins as needed.
- Real-Time Analysis: View Lifeway Foods’ intrinsic value update instantly.
- Intuitive Visualizations: Dashboard graphs illustrate valuation outcomes and essential metrics.
- Designed for Precision: A specialized tool for analysts, investors, and finance professionals.
How It Works
- Step 1: Download the Excel file.
- Step 2: Review pre-entered Lifeway Foods data (historical and projected).
- Step 3: Adjust key assumptions (yellow cells) based on your analysis.
- Step 4: View automatic recalculations for Lifeway Foods’ intrinsic value.
- Step 5: Use the outputs for investment decisions or reporting.
Why Choose This Calculator for Lifeway Foods, Inc. (LWAY)?
- Designed for Industry Experts: A specialized tool favored by financial analysts, CFOs, and industry consultants.
- Comprehensive Data: Lifeway's historical and projected financials are preloaded for enhanced precision.
- Flexible Scenario Analysis: Effortlessly test various forecasts and assumptions to inform your decisions.
- Insightful Outputs: Automatically computes intrinsic value, NPV, and essential financial metrics.
- User-Friendly Interface: Step-by-step guidance ensures a smooth and straightforward experience.
Who Should Use This Product?
- Individual Investors: Make informed decisions about buying or selling Lifeway Foods stock (LWAY).
- Financial Analysts: Streamline valuation processes with ready-to-use financial models specific to Lifeway Foods (LWAY).
- Consultants: Deliver professional valuation insights regarding Lifeway Foods (LWAY) to clients quickly and accurately.
- Business Owners: Understand how companies like Lifeway Foods (LWAY) are valued to guide your own strategy.
- Finance Students: Learn valuation techniques using real-world data and scenarios related to Lifeway Foods (LWAY).
What the Template Contains
- Operating and Balance Sheet Data: Pre-filled Lifeway Foods historical data and forecasts, including revenue, EBITDA, EBIT, and capital expenditures.
- WACC Calculation: A dedicated sheet for Weighted Average Cost of Capital (WACC), including parameters like Beta, risk-free rate, and share price.
- DCF Valuation (Unlevered and Levered): Editable Discounted Cash Flow models showing intrinsic value with detailed calculations.
- Financial Statements: Pre-loaded financial statements (annual and quarterly) to support analysis.
- Key Ratios: Includes profitability, leverage, and efficiency ratios for Lifeway Foods, Inc. (LWAY).
- Dashboard and Charts: Visual summary of valuation outputs and assumptions to analyze results easily.
Disclaimer
All information, articles, and product details provided on this website are for general informational and educational purposes only. We do not claim any ownership over, nor do we intend to infringe upon, any trademarks, copyrights, logos, brand names, or other intellectual property mentioned or depicted on this site. Such intellectual property remains the property of its respective owners, and any references here are made solely for identification or informational purposes, without implying any affiliation, endorsement, or partnership.
We make no representations or warranties, express or implied, regarding the accuracy, completeness, or suitability of any content or products presented. Nothing on this website should be construed as legal, tax, investment, financial, medical, or other professional advice. In addition, no part of this site—including articles or product references—constitutes a solicitation, recommendation, endorsement, advertisement, or offer to buy or sell any securities, franchises, or other financial instruments, particularly in jurisdictions where such activity would be unlawful.
All content is of a general nature and may not address the specific circumstances of any individual or entity. It is not a substitute for professional advice or services. Any actions you take based on the information provided here are strictly at your own risk. You accept full responsibility for any decisions or outcomes arising from your use of this website and agree to release us from any liability in connection with your use of, or reliance upon, the content or products found herein.