
|
Manappuram Finance Limited (MANAPPURAM.NS) Avaliação DCF |
Totalmente Editável: Adapte-Se Às Suas Necessidades No Excel Ou Planilhas
Design Profissional: Modelos Confiáveis E Padrão Da Indústria
Pré-Construídos Para Uso Rápido E Eficiente
Compatível com MAC/PC, totalmente desbloqueado
Não É Necessária Experiência; Fácil De Seguir
Manappuram Finance Limited (MANAPPURAM.NS) Bundle
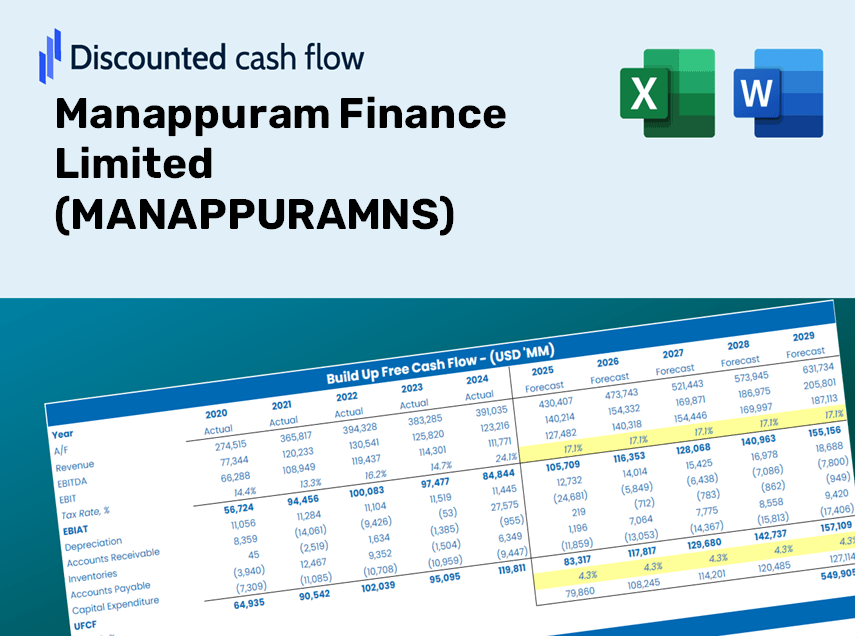
Explore o potencial financeiro da Manappuram Finance Limited (MANAPPURAMNS) com a nossa calculadora DCF fácil de usar! Digite suas suposições de crescimento, margens e custos para calcular o valor intrínseco da Manappuram Finance Limited (MANAPPURAMNS) e refine sua estratégia de investimento.
Discounted Cash Flow (DCF) - (USD MM)
| Year | AY1 2021 |
AY2 2022 |
AY3 2023 |
AY4 2024 |
AY5 2025 |
FY1 2026 |
FY2 2027 |
FY3 2028 |
FY4 2029 |
FY5 2030 |
|---|---|---|---|---|---|---|---|---|---|---|
| Revenue | 63,369.0 | 60,494.6 | 66,462.0 | 54,178.7 | 65,002.1 | 66,111.0 | 67,238.9 | 68,386.0 | 69,552.6 | 70,739.2 |
| Revenue Growth, % | 0 | -4.54 | 9.86 | -18.48 | 19.98 | 1.71 | 1.71 | 1.71 | 1.71 | 1.71 |
| EBITDA | 47,361.6 | 40,330.9 | 22,449.3 | 61,393.7 | 55,679.6 | 47,711.5 | 48,525.5 | 49,353.3 | 50,195.3 | 51,051.6 |
| EBITDA, % | 74.74 | 66.67 | 33.78 | 113.32 | 85.66 | 72.17 | 72.17 | 72.17 | 72.17 | 72.17 |
| Depreciation | 1,709.5 | 1,979.8 | 2,038.8 | 2,464.5 | 2,673.7 | 2,340.3 | 2,380.3 | 2,420.9 | 2,462.2 | 2,504.2 |
| Depreciation, % | 2.7 | 3.27 | 3.07 | 4.55 | 4.11 | 3.54 | 3.54 | 3.54 | 3.54 | 3.54 |
| EBIT | 45,652.1 | 38,351.1 | 20,410.5 | 58,929.3 | 53,005.9 | 45,972.6 | 46,756.9 | 47,554.6 | 48,365.9 | 49,191.0 |
| EBIT, % | 72.04 | 63.4 | 30.71 | 108.77 | 81.54 | 69.54 | 69.54 | 69.54 | 69.54 | 69.54 |
| Total Cash | 27,704.1 | 25,849.2 | 30,351.0 | 28,296.7 | 35,744.5 | 31,645.2 | 32,185.0 | 32,734.1 | 33,292.5 | 33,860.5 |
| Total Cash, percent | .0 | .0 | .0 | .0 | .0 | .0 | .0 | .0 | .0 | .0 |
| Account Receivables | 27.3 | 87.7 | 2.2 | 1,359.4 | 1,262.0 | 613.8 | 624.2 | 634.9 | 645.7 | 656.7 |
| Account Receivables, % | 0.04312836 | 0.14496 | 0.00332521 | 2.51 | 1.94 | 0.92839 | 0.92839 | 0.92839 | 0.92839 | 0.92839 |
| Inventories | .0 | 26,973.5 | 30,351.0 | 31,809.3 | .0 | 19,696.7 | 20,032.7 | 20,374.5 | 20,722.1 | 21,075.6 |
| Inventories, % | 0 | 44.59 | 45.67 | 58.71 | 0 | 29.79 | 29.79 | 29.79 | 29.79 | 29.79 |
| Accounts Payable | 1,449.7 | 1,735.4 | 1,619.7 | 2,235.5 | 2,235.5 | 2,004.3 | 2,038.5 | 2,073.3 | 2,108.7 | 2,144.6 |
| Accounts Payable, % | 2.29 | 2.87 | 2.44 | 4.13 | 3.44 | 3.03 | 3.03 | 3.03 | 3.03 | 3.03 |
| Capital Expenditure | -532.3 | -1,627.9 | -1,726.4 | -1,363.3 | -1,958.2 | -1,541.4 | -1,567.6 | -1,594.4 | -1,621.6 | -1,649.3 |
| Capital Expenditure, % | -0.83994 | -2.69 | -2.6 | -2.52 | -3.01 | -2.33 | -2.33 | -2.33 | -2.33 | -2.33 |
| Tax Rate, % | 26.99 | 26.99 | 26.99 | 26.99 | 26.99 | 26.99 | 26.99 | 26.99 | 26.99 | 26.99 |
| EBITAT | 33,987.4 | 28,565.3 | 14,959.8 | 43,580.6 | 38,701.7 | 33,945.7 | 34,524.8 | 35,113.8 | 35,712.9 | 36,322.1 |
| Depreciation | ||||||||||
| Changes in Account Receivables | ||||||||||
| Changes in Inventories | ||||||||||
| Changes in Accounts Payable | ||||||||||
| Capital Expenditure | ||||||||||
| UFCF | 36,587.0 | 2,169.0 | 11,864.5 | 42,482.1 | 71,323.9 | 15,465.0 | 35,025.1 | 35,622.7 | 36,230.4 | 36,848.5 |
| WACC, % | 7.09 | 7.09 | 7.02 | 7.06 | 7 | 7.05 | 7.05 | 7.05 | 7.05 | 7.05 |
| PV UFCF | ||||||||||
| SUM PV UFCF | 127,840.8 | |||||||||
| Long Term Growth Rate, % | 2.00 | |||||||||
| Free cash flow (T + 1) | 37,585 | |||||||||
| Terminal Value | 743,994 | |||||||||
| Present Terminal Value | 529,174 | |||||||||
| Enterprise Value | 657,015 | |||||||||
| Net Debt | 329,900 | |||||||||
| Equity Value | 327,115 | |||||||||
| Diluted Shares Outstanding, MM | 855 | |||||||||
| Equity Value Per Share | 382.48 |
What You Will Receive
- Authentic MANAPPURAM Financial Data: Pre-loaded with Manappuram Finance Limited's historical and projected figures for accurate analysis.
- Completely Customizable Template: Effortlessly adjust key inputs such as revenue growth, WACC, and EBITDA percentage.
- Instant Calculations: Watch MANAPPURAM's intrinsic value refresh immediately as you make modifications.
- Professional Valuation Resource: Ideal for investors, analysts, and consultants aiming for precise DCF outcomes.
- User-Centric Layout: Intuitive design and straightforward instructions suitable for all skill levels.
Key Features
- Comprehensive Data: Manappuram Finance Limited’s historical financial records and pre-filled projections.
- Customizable Inputs: Adjust WACC, tax rates, revenue growth, and EBITDA margins to suit your analysis.
- Real-Time Results: Observe the intrinsic value of Manappuram Finance Limited recalculating instantly.
- Intuitive Visual Outputs: Dashboard charts highlight valuation outcomes and essential metrics.
- Designed for Precision: A professional-grade tool tailored for analysts, investors, and finance professionals.
How It Works
- Step 1: Download the Excel file.
- Step 2: Review Manappuram Finance Limited's (MANAPPURAMNS) pre-filled financial data and forecasts.
- Step 3: Adjust key inputs such as revenue growth, WACC, and tax rates (cells highlighted for your convenience).
- Step 4: Observe the DCF model refresh in real-time as you modify your assumptions.
- Step 5: Examine the outputs and leverage the results for your investment strategies.
Reasons to Choose This Calculator for Manappuram Finance Limited (MANAPPURAMNS)
- All-in-One Solution: Combines DCF, WACC, and financial ratio evaluations for comprehensive analysis.
- Flexible Inputs: Modify the yellow-highlighted cells to explore different financial scenarios.
- In-Depth Analysis: Automatically determines Manappuram Finance’s intrinsic value and Net Present Value.
- Preloaded Information: Includes both historical and projected data for precise analysis.
- High-Quality Standards: Perfect for financial analysts, investors, and business consultants working with (MANAPPURAMNS).
Who Can Benefit from Manappuram Finance Limited (MANAPPURAMNS)?
- Investors: Make informed choices with a reliable valuation tool catered to your needs.
- Financial Analysts: Streamline your workflow with a customizable DCF model at your fingertips.
- Consultants: Effortlessly modify the template for impactful client presentations or reports.
- Finance Enthusiasts: Enhance your knowledge of valuation methods through practical, real-world scenarios.
- Educators and Students: Employ it as a hands-on resource in finance education and coursework.
Contents of the Template
- Operating and Balance Sheet Data: Pre-filled historical data and forecasts for Manappuram Finance Limited (MANAPPURAMNS), including revenue, EBITDA, EBIT, and capital expenditures.
- WACC Calculation: A dedicated sheet for Weighted Average Cost of Capital (WACC), featuring parameters such as Beta, risk-free rate, and share price.
- DCF Valuation (Unlevered and Levered): Customizable Discounted Cash Flow models that reveal intrinsic value, complete with detailed calculations.
- Financial Statements: Pre-loaded annual and quarterly financial statements to aid in comprehensive analysis.
- Key Ratios: A collection of profitability, leverage, and efficiency ratios pertinent to Manappuram Finance Limited (MANAPPURAMNS).
- Dashboard and Charts: A visual summary of valuation outputs and assumptions, designed for easy result analysis.
Disclaimer
All information, articles, and product details provided on this website are for general informational and educational purposes only. We do not claim any ownership over, nor do we intend to infringe upon, any trademarks, copyrights, logos, brand names, or other intellectual property mentioned or depicted on this site. Such intellectual property remains the property of its respective owners, and any references here are made solely for identification or informational purposes, without implying any affiliation, endorsement, or partnership.
We make no representations or warranties, express or implied, regarding the accuracy, completeness, or suitability of any content or products presented. Nothing on this website should be construed as legal, tax, investment, financial, medical, or other professional advice. In addition, no part of this site—including articles or product references—constitutes a solicitation, recommendation, endorsement, advertisement, or offer to buy or sell any securities, franchises, or other financial instruments, particularly in jurisdictions where such activity would be unlawful.
All content is of a general nature and may not address the specific circumstances of any individual or entity. It is not a substitute for professional advice or services. Any actions you take based on the information provided here are strictly at your own risk. You accept full responsibility for any decisions or outcomes arising from your use of this website and agree to release us from any liability in connection with your use of, or reliance upon, the content or products found herein.