
|
CE Info Systems Ltd. (MapMyindia.NS) DCF Avaliação |
Totalmente Editável: Adapte-Se Às Suas Necessidades No Excel Ou Planilhas
Design Profissional: Modelos Confiáveis E Padrão Da Indústria
Pré-Construídos Para Uso Rápido E Eficiente
Compatível com MAC/PC, totalmente desbloqueado
Não É Necessária Experiência; Fácil De Seguir
C. E. Info Systems Limited (MAPMYINDIA.NS) Bundle
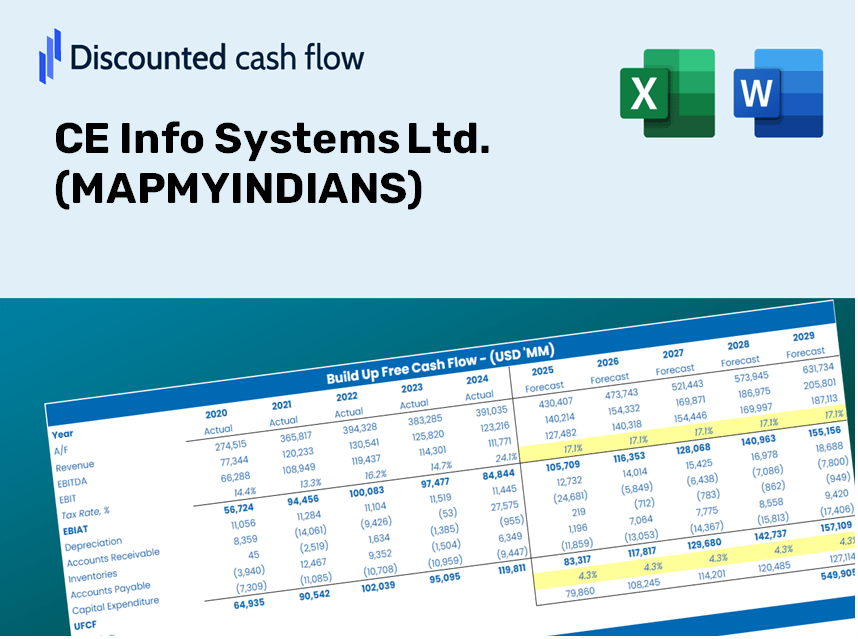
Procurando determinar o valor intrínseco da CE Info Systems Ltd.? Nossa calculadora DCF (MapMyindians) integra dados do mundo real com extensos recursos de personalização, permitindo ajustar as previsões e aprimorar suas estratégias de investimento.
Discounted Cash Flow (DCF) - (USD MM)
| Year | AY1 2021 |
AY2 2022 |
AY3 2023 |
AY4 2024 |
AY5 2025 |
FY1 2026 |
FY2 2027 |
FY3 2028 |
FY4 2029 |
FY5 2030 |
|---|---|---|---|---|---|---|---|---|---|---|
| Revenue | 1,524.6 | 2,004.4 | 2,814.6 | 3,794.2 | 4,632.5 | 6,124.0 | 8,095.8 | 10,702.3 | 14,148.1 | 18,703.4 |
| Revenue Growth, % | 0 | 31.47 | 40.42 | 34.8 | 22.09 | 32.2 | 32.2 | 32.2 | 32.2 | 32.2 |
| EBITDA | 910.7 | 1,276.1 | 1,521.0 | 1,942.4 | 1,799.1 | 3,276.0 | 4,330.8 | 5,725.1 | 7,568.4 | 10,005.2 |
| EBITDA, % | 59.73 | 63.67 | 54.04 | 51.19 | 38.84 | 53.49 | 53.49 | 53.49 | 53.49 | 53.49 |
| Depreciation | 98.0 | 82.6 | 99.0 | 146.7 | 195.8 | 271.4 | 358.8 | 474.3 | 627.0 | 828.8 |
| Depreciation, % | 6.43 | 4.12 | 3.52 | 3.87 | 4.23 | 4.43 | 4.43 | 4.43 | 4.43 | 4.43 |
| EBIT | 812.8 | 1,193.5 | 1,422.0 | 1,795.7 | 1,603.3 | 3,004.6 | 3,972.0 | 5,250.9 | 6,941.5 | 9,176.4 |
| EBIT, % | 53.31 | 59.55 | 50.52 | 47.33 | 34.61 | 49.06 | 49.06 | 49.06 | 49.06 | 49.06 |
| Total Cash | 2,213.7 | 1,827.5 | 3,316.4 | 2,839.5 | 3,648.6 | 5,447.6 | 7,201.6 | 9,520.3 | 12,585.5 | 16,637.6 |
| Total Cash, percent | .0 | .0 | .0 | .0 | .0 | .0 | .0 | .0 | .0 | .0 |
| Account Receivables | 432.9 | 705.8 | 828.5 | 1,254.2 | 1,653.6 | 1,981.7 | 2,619.7 | 3,463.2 | 4,578.2 | 6,052.3 |
| Account Receivables, % | 28.4 | 35.21 | 29.44 | 33.06 | 35.7 | 32.36 | 32.36 | 32.36 | 32.36 | 32.36 |
| Inventories | 27.6 | 79.7 | 159.7 | 119.5 | 167.9 | 223.3 | 295.2 | 390.3 | 516.0 | 682.1 |
| Inventories, % | 1.81 | 3.98 | 5.67 | 3.15 | 3.62 | 3.65 | 3.65 | 3.65 | 3.65 | 3.65 |
| Accounts Payable | 44.5 | 60.9 | 130.9 | 250.6 | 302.1 | 290.7 | 384.3 | 508.0 | 671.6 | 887.8 |
| Accounts Payable, % | 2.92 | 3.04 | 4.65 | 6.6 | 6.52 | 4.75 | 4.75 | 4.75 | 4.75 | 4.75 |
| Capital Expenditure | -22.1 | -39.9 | -225.4 | -273.8 | -493.8 | -359.2 | -474.8 | -627.7 | -829.8 | -1,097.0 |
| Capital Expenditure, % | -1.45 | -1.99 | -8.01 | -7.22 | -10.66 | -5.86 | -5.86 | -5.86 | -5.86 | -5.86 |
| Tax Rate, % | 28.44 | 28.44 | 28.44 | 28.44 | 28.44 | 28.44 | 28.44 | 28.44 | 28.44 | 28.44 |
| EBITAT | 616.4 | 885.3 | 1,095.1 | 1,373.6 | 1,147.3 | 2,254.0 | 2,979.7 | 3,939.0 | 5,207.2 | 6,883.8 |
| Depreciation | ||||||||||
| Changes in Account Receivables | ||||||||||
| Changes in Inventories | ||||||||||
| Changes in Accounts Payable | ||||||||||
| Capital Expenditure | ||||||||||
| UFCF | 276.2 | 619.4 | 836.1 | 980.7 | 453.0 | 1,771.2 | 2,247.2 | 2,970.8 | 3,927.3 | 5,191.7 |
| WACC, % | 4.67 | 4.67 | 4.68 | 4.68 | 4.67 | 4.67 | 4.67 | 4.67 | 4.67 | 4.67 |
| PV UFCF | ||||||||||
| SUM PV UFCF | 13,736.3 | |||||||||
| Long Term Growth Rate, % | 4.00 | |||||||||
| Free cash flow (T + 1) | 5,399 | |||||||||
| Terminal Value | 800,385 | |||||||||
| Present Terminal Value | 636,931 | |||||||||
| Enterprise Value | 650,668 | |||||||||
| Net Debt | -375 | |||||||||
| Equity Value | 651,043 | |||||||||
| Diluted Shares Outstanding, MM | 55 | |||||||||
| Equity Value Per Share | 11,840.37 |
What You Will Receive
- Customizable Excel Template: An adaptable Excel-based DCF Calculator featuring pre-filled financials for CE Info Systems Ltd. (MAPMYINDIANS).
- Comprehensive Data: Access to historical financial data and forward-looking projections (highlighted in the yellow cells).
- Flexible Forecasting: Adjust key assumptions such as revenue growth, EBITDA %, and WACC to suit your analysis.
- Instant Calculations: Quickly observe how your inputs affect the valuation of CE Info Systems Ltd. (MAPMYINDIANS).
- Professional-Grade Tool: Designed for investors, CFOs, consultants, and financial analysts.
- User-Friendly Interface: Organized for clarity and efficiency, complete with step-by-step guidance.
Key Features
- Comprehensive DCF Calculator: Offers detailed unlevered and levered DCF valuation models tailored for CE Info Systems Ltd. (MAPMYINDIANS).
- WACC Calculator: Features a pre-built Weighted Average Cost of Capital sheet with customizable parameters.
- Customizable Forecast Assumptions: Easily adjust growth rates, capital expenditures, and discount rates.
- Inbuilt Financial Ratios: Evaluate profitability, leverage, and efficiency ratios specifically for CE Info Systems Ltd. (MAPMYINDIANS).
- Interactive Dashboard and Charts: Visual representations summarize key valuation metrics for straightforward analysis.
How It Operates
- Download the Template: Gain immediate access to the Excel-based CE Info Systems Ltd. (MAPMYINDIANS) DCF Calculator.
- Input Your Assumptions: Modify the yellow-highlighted cells for growth rates, WACC, margins, and other key factors.
- Instant Calculations: The model automatically recalculates the intrinsic value of CE Info Systems Ltd. (MAPMYINDIANS).
- Test Scenarios: Experiment with various assumptions to assess potential changes in valuation.
- Analyze and Decide: Utilize the results to inform your investment choices or financial analysis.
Why Choose This Calculator for CE Info Systems Ltd. (MAPMYINDIANS)?
- All-in-One Solution: Combines DCF, WACC, and financial ratio analyses into a single user-friendly tool.
- Flexible Inputs: Modify the yellow-highlighted fields to explore a range of financial scenarios.
- In-Depth Analysis: Automatically determines CE Info Systems Ltd.’s intrinsic value and Net Present Value.
- Ready-to-Use Data: Access both historical and projected data for reliable analysis.
- Expert Level: Perfectly suited for financial analysts, investors, and business consultants.
Who Can Benefit from CE Info Systems Ltd. (MAPMYINDIANS) [MAPS]?
- Investors: Evaluate the market performance of CE Info Systems before making investment decisions.
- CFOs and Financial Analysts: Optimize valuation methods and validate financial forecasts.
- Startup Founders: Discover insights on how leading tech firms like CE Info Systems are valued.
- Consultants: Provide clients with detailed and expert valuation analyses.
- Students and Educators: Leverage real-time data to teach and practice valuation strategies.
Contents of the Template
- Pre-Filled Data: Contains CE Info Systems Ltd.'s historical financials and projections.
- Discounted Cash Flow Model: An editable DCF valuation model featuring automatic computations.
- Weighted Average Cost of Capital (WACC): A separate sheet for WACC calculation based on user-defined inputs.
- Key Financial Ratios: Evaluate CE Info Systems Ltd.'s profitability, efficiency, and financial leverage.
- Customizable Inputs: Easily modify revenue growth rates, margins, and tax percentages.
- Clear Dashboard: Visualizations and tables that summarize essential valuation outcomes.
Disclaimer
All information, articles, and product details provided on this website are for general informational and educational purposes only. We do not claim any ownership over, nor do we intend to infringe upon, any trademarks, copyrights, logos, brand names, or other intellectual property mentioned or depicted on this site. Such intellectual property remains the property of its respective owners, and any references here are made solely for identification or informational purposes, without implying any affiliation, endorsement, or partnership.
We make no representations or warranties, express or implied, regarding the accuracy, completeness, or suitability of any content or products presented. Nothing on this website should be construed as legal, tax, investment, financial, medical, or other professional advice. In addition, no part of this site—including articles or product references—constitutes a solicitation, recommendation, endorsement, advertisement, or offer to buy or sell any securities, franchises, or other financial instruments, particularly in jurisdictions where such activity would be unlawful.
All content is of a general nature and may not address the specific circumstances of any individual or entity. It is not a substitute for professional advice or services. Any actions you take based on the information provided here are strictly at your own risk. You accept full responsibility for any decisions or outcomes arising from your use of this website and agree to release us from any liability in connection with your use of, or reliance upon, the content or products found herein.