
|
908 Devices Inc. (Mass) Avaliação DCF |
Totalmente Editável: Adapte-Se Às Suas Necessidades No Excel Ou Planilhas
Design Profissional: Modelos Confiáveis E Padrão Da Indústria
Pré-Construídos Para Uso Rápido E Eficiente
Compatível com MAC/PC, totalmente desbloqueado
Não É Necessária Experiência; Fácil De Seguir
908 Devices Inc. (MASS) Bundle
Obtenha informações sobre sua análise de avaliação 908 Devices Inc. (Mass) usando nossa calculadora DCF de ponta! Equipado com dados de massa reais, este modelo do Excel permite ajustar as previsões e suposições para determinar o valor intrínseco da 908 Devices Inc. com precisão.
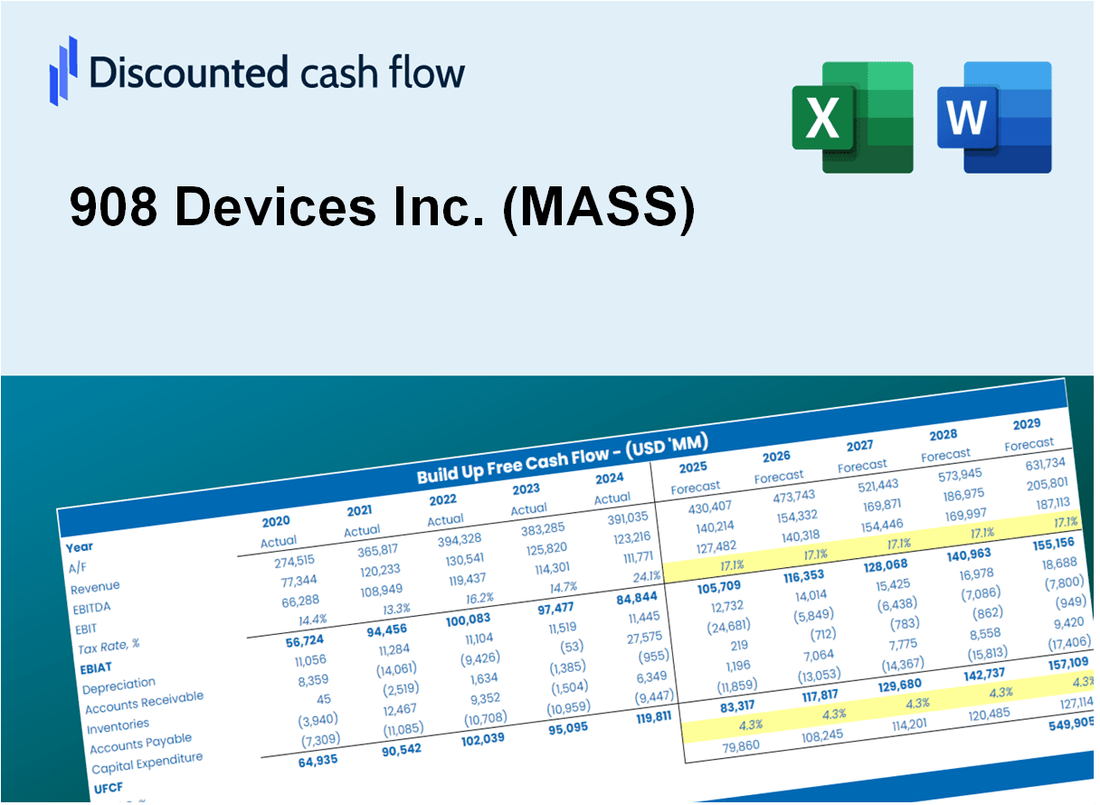
Discounted Cash Flow (DCF) - (USD MM)
| Year | AY1 2020 |
AY2 2021 |
AY3 2022 |
AY4 2023 |
AY5 2024 |
FY1 2025 |
FY2 2026 |
FY3 2027 |
FY4 2028 |
FY5 2029 |
|---|---|---|---|---|---|---|---|---|---|---|
| Revenue | 26.9 | 42.2 | 46.9 | 50.2 | 59.6 | 73.6 | 90.9 | 112.2 | 138.6 | 171.1 |
| Revenue Growth, % | 0 | 56.93 | 11.01 | 7.21 | 18.72 | 23.47 | 23.47 | 23.47 | 23.47 | 23.47 |
| EBITDA | -11.0 | -20.9 | -31.8 | -34.0 | -67.8 | -48.0 | -59.3 | -73.2 | -90.4 | -111.6 |
| EBITDA, % | -40.95 | -49.6 | -67.92 | -67.74 | -113.71 | -65.24 | -65.24 | -65.24 | -65.24 | -65.24 |
| Depreciation | .8 | .9 | 1.6 | 2.4 | 4.7 | 3.1 | 3.9 | 4.8 | 5.9 | 7.3 |
| Depreciation, % | 3.09 | 2.19 | 3.44 | 4.75 | 7.85 | 4.26 | 4.26 | 4.26 | 4.26 | 4.26 |
| EBIT | -11.8 | -21.9 | -33.4 | -36.4 | -72.5 | -50.0 | -61.8 | -76.2 | -94.1 | -116.2 |
| EBIT, % | -44.04 | -51.8 | -71.36 | -72.49 | -121.56 | -67.94 | -67.94 | -67.94 | -67.94 | -67.94 |
| Total Cash | 159.2 | 224.1 | 188.4 | 145.7 | 69.6 | 73.6 | 90.9 | 112.2 | 138.6 | 171.1 |
| Total Cash, percent | .0 | .0 | .0 | .0 | .0 | .0 | .0 | .0 | .0 | .0 |
| Account Receivables | 6.9 | 16.4 | 10.0 | 9.0 | 12.6 | 18.4 | 22.7 | 28.0 | 34.6 | 42.7 |
| Account Receivables, % | 25.55 | 38.8 | 21.41 | 17.9 | 21.18 | 24.97 | 24.97 | 24.97 | 24.97 | 24.97 |
| Inventories | 4.6 | 7.9 | 12.5 | 14.9 | 16.2 | 17.6 | 21.7 | 26.8 | 33.1 | 40.8 |
| Inventories, % | 16.99 | 18.76 | 26.71 | 29.74 | 27.12 | 23.86 | 23.86 | 23.86 | 23.86 | 23.86 |
| Accounts Payable | 1.0 | 1.4 | 1.4 | 1.2 | 2.1 | 2.3 | 2.9 | 3.5 | 4.4 | 5.4 |
| Accounts Payable, % | 3.73 | 3.25 | 2.98 | 2.37 | 3.46 | 3.16 | 3.16 | 3.16 | 3.16 | 3.16 |
| Capital Expenditure | .0 | -.7 | -2.0 | -2.0 | -.6 | -1.7 | -2.0 | -2.5 | -3.1 | -3.8 |
| Capital Expenditure, % | -0.03346471 | -1.75 | -4.36 | -4.07 | -1.01 | -2.25 | -2.25 | -2.25 | -2.25 | -2.25 |
| Tax Rate, % | 0.38903 | 0.38903 | 0.38903 | 0.38903 | 0.38903 | 0.38903 | 0.38903 | 0.38903 | 0.38903 | 0.38903 |
| EBITAT | -6.4 | -21.8 | -31.6 | -36.2 | -72.2 | -44.8 | -55.3 | -68.2 | -84.3 | -104.0 |
| Depreciation | ||||||||||
| Changes in Account Receivables | ||||||||||
| Changes in Inventories | ||||||||||
| Changes in Accounts Payable | ||||||||||
| Capital Expenditure | ||||||||||
| UFCF | -16.0 | -34.1 | -30.3 | -37.4 | -72.1 | -50.2 | -61.3 | -75.7 | -93.5 | -115.4 |
| WACC, % | 5.77 | 5.81 | 5.81 | 5.81 | 5.81 | 5.8 | 5.8 | 5.8 | 5.8 | 5.8 |
| PV UFCF | ||||||||||
| SUM PV UFCF | -327.8 | |||||||||
| Long Term Growth Rate, % | 2.00 | |||||||||
| Free cash flow (T + 1) | -118 | |||||||||
| Terminal Value | -3,096 | |||||||||
| Present Terminal Value | -2,336 | |||||||||
| Enterprise Value | -2,663 | |||||||||
| Net Debt | -37 | |||||||||
| Equity Value | -2,626 | |||||||||
| Diluted Shares Outstanding, MM | 34 | |||||||||
| Equity Value Per Share | -77.06 |
What You Will Get
- Real 908 Devices Data: Preloaded financials – from revenue to EBIT – based on actual and projected figures.
- Full Customization: Adjust all critical parameters (yellow cells) like WACC, growth %, and tax rates.
- Instant Valuation Updates: Automatic recalculations to analyze the impact of changes on 908 Devices’ fair value.
- Versatile Excel Template: Tailored for quick edits, scenario testing, and detailed projections.
- Time-Saving and Accurate: Skip building models from scratch while maintaining precision and flexibility.
Key Features
- Comprehensive Financial Insights: Gain access to precise historical data and future estimates for 908 Devices Inc. (MASS).
- Tailorable Forecast Parameters: Modify highlighted cells for key metrics such as WACC, growth rates, and profit margins.
- Real-Time Calculations: Automatic updates for DCF, Net Present Value (NPV), and cash flow assessments.
- Interactive Visual Dashboard: User-friendly charts and summaries to effectively present your valuation findings.
- Designed for All Levels: An intuitive layout suitable for investors, CFOs, and consultants alike.
How It Works
- Step 1: Download the Excel file for 908 Devices Inc. (MASS).
- Step 2: Review the pre-filled financial data and forecasts for 908 Devices Inc. (MASS).
- Step 3: Modify key inputs such as revenue growth, WACC, and tax rates (highlighted cells).
- Step 4: Observe the DCF model update in real-time as you adjust your assumptions.
- Step 5: Analyze the results and leverage the findings for your investment decisions regarding 908 Devices Inc. (MASS).
Why Choose 908 Devices Inc. (MASS)?
- Innovative Technology: Cutting-edge solutions that streamline analytical processes.
- Enhanced Reliability: High-quality data and robust systems minimize errors in results.
- Custom Solutions: Adaptable products designed to meet specific client needs and requirements.
- User-Friendly Interface: Intuitive designs and clear visuals facilitate easy data interpretation.
- Industry Recognition: Valued by professionals for our commitment to excellence and performance.
Who Should Use This Product?
- Professional Investors: Develop comprehensive and accurate valuation models for portfolio assessments of 908 Devices Inc. (MASS).
- Corporate Finance Teams: Evaluate valuation scenarios to inform strategic decisions within their organizations.
- Consultants and Advisors: Deliver precise valuation insights to clients interested in 908 Devices Inc. (MASS).
- Students and Educators: Utilize real-world data to enhance learning and practice in financial modeling.
- Tech Enthusiasts: Gain insights into how companies like 908 Devices Inc. (MASS) are valued in the tech industry.
What the Template Contains
- Historical Data: Includes 908 Devices Inc.’s past financials and baseline forecasts.
- DCF and Levered DCF Models: Detailed templates to calculate 908 Devices Inc.’s intrinsic value.
- WACC Sheet: Pre-built calculations for Weighted Average Cost of Capital.
- Editable Inputs: Modify key drivers like growth rates, EBITDA %, and CAPEX assumptions.
- Quarterly and Annual Statements: A complete breakdown of 908 Devices Inc.’s financials.
- Interactive Dashboard: Visualize valuation results and projections dynamically.
Disclaimer
All information, articles, and product details provided on this website are for general informational and educational purposes only. We do not claim any ownership over, nor do we intend to infringe upon, any trademarks, copyrights, logos, brand names, or other intellectual property mentioned or depicted on this site. Such intellectual property remains the property of its respective owners, and any references here are made solely for identification or informational purposes, without implying any affiliation, endorsement, or partnership.
We make no representations or warranties, express or implied, regarding the accuracy, completeness, or suitability of any content or products presented. Nothing on this website should be construed as legal, tax, investment, financial, medical, or other professional advice. In addition, no part of this site—including articles or product references—constitutes a solicitation, recommendation, endorsement, advertisement, or offer to buy or sell any securities, franchises, or other financial instruments, particularly in jurisdictions where such activity would be unlawful.
All content is of a general nature and may not address the specific circumstances of any individual or entity. It is not a substitute for professional advice or services. Any actions you take based on the information provided here are strictly at your own risk. You accept full responsibility for any decisions or outcomes arising from your use of this website and agree to release us from any liability in connection with your use of, or reliance upon, the content or products found herein.