
|
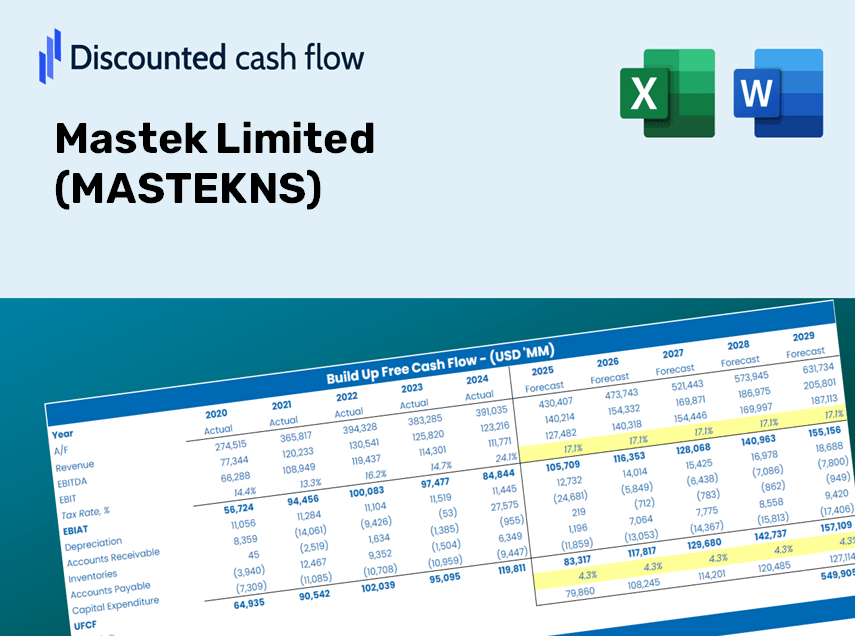
Avaliação DCF da Mastek Limited (mastek.ns) |
Totalmente Editável: Adapte-Se Às Suas Necessidades No Excel Ou Planilhas
Design Profissional: Modelos Confiáveis E Padrão Da Indústria
Pré-Construídos Para Uso Rápido E Eficiente
Compatível com MAC/PC, totalmente desbloqueado
Não É Necessária Experiência; Fácil De Seguir
Mastek Limited (MASTEK.NS) Bundle
Projetado para precisão, nossa calculadora DCF (Mastekns) capacita você a avaliar a avaliação da Mastek Limited usando dados financeiros do mundo real, oferecendo flexibilidade completa para modificar todos os parâmetros essenciais para melhorar projeções.
Discounted Cash Flow (DCF) - (USD MM)
| Year | AY1 2021 |
AY2 2022 |
AY3 2023 |
AY4 2024 |
AY5 2025 |
FY1 2026 |
FY2 2027 |
FY3 2028 |
FY4 2029 |
FY5 2030 |
|---|---|---|---|---|---|---|---|---|---|---|
| Revenue | 17,218.6 | 21,838.4 | 25,633.9 | 30,547.9 | 34,552.3 | 41,159.5 | 49,030.0 | 58,405.7 | 69,574.1 | 82,878.2 |
| Revenue Growth, % | 0 | 26.83 | 17.38 | 19.17 | 13.11 | 19.12 | 19.12 | 19.12 | 19.12 | 19.12 |
| EBITDA | 3,920.3 | 4,982.3 | 5,192.8 | 5,186.6 | 5,489.6 | 8,125.4 | 9,679.1 | 11,530.0 | 13,734.8 | 16,361.2 |
| EBITDA, % | 22.77 | 22.81 | 20.26 | 16.98 | 15.89 | 19.74 | 19.74 | 19.74 | 19.74 | 19.74 |
| Depreciation | 446.0 | 425.1 | 671.9 | 899.1 | 751.2 | 1,010.5 | 1,203.7 | 1,433.9 | 1,708.1 | 2,034.7 |
| Depreciation, % | 2.59 | 1.95 | 2.62 | 2.94 | 2.17 | 2.46 | 2.46 | 2.46 | 2.46 | 2.46 |
| EBIT | 3,474.3 | 4,557.2 | 4,520.9 | 4,287.5 | 4,738.4 | 7,114.9 | 8,475.4 | 10,096.1 | 12,026.7 | 14,326.5 |
| EBIT, % | 20.18 | 20.87 | 17.64 | 14.04 | 13.71 | 17.29 | 17.29 | 17.29 | 17.29 | 17.29 |
| Total Cash | 8,007.2 | 7,816.3 | 2,638.1 | 4,586.1 | 6,221.3 | 10,339.6 | 12,316.8 | 14,672.0 | 17,477.6 | 20,819.7 |
| Total Cash, percent | .0 | .0 | .0 | .0 | .0 | .0 | .0 | .0 | .0 | .0 |
| Account Receivables | 5,052.7 | 6,373.8 | 9,280.3 | 9,141.5 | 9,681.2 | 12,568.3 | 14,971.6 | 17,834.5 | 21,244.9 | 25,307.3 |
| Account Receivables, % | 29.34 | 29.19 | 36.2 | 29.93 | 28.02 | 30.54 | 30.54 | 30.54 | 30.54 | 30.54 |
| Inventories | .0 | 2,960.9 | .0 | -372.4 | .0 | 1,015.7 | 1,210.0 | 1,441.4 | 1,717.0 | 2,045.3 |
| Inventories, % | 0 | 13.56 | 0 | -1.22 | 0 | 2.47 | 2.47 | 2.47 | 2.47 | 2.47 |
| Accounts Payable | 306.9 | 332.7 | 258.6 | 614.2 | 2,559.9 | 1,130.6 | 1,346.8 | 1,604.3 | 1,911.1 | 2,276.5 |
| Accounts Payable, % | 1.78 | 1.52 | 1.01 | 2.01 | 7.41 | 2.75 | 2.75 | 2.75 | 2.75 | 2.75 |
| Capital Expenditure | -117.5 | -368.5 | -315.0 | -314.5 | -201.2 | -428.9 | -510.9 | -608.6 | -725.0 | -863.7 |
| Capital Expenditure, % | -0.6824 | -1.69 | -1.23 | -1.03 | -0.58231 | -1.04 | -1.04 | -1.04 | -1.04 | -1.04 |
| Tax Rate, % | 18.13 | 18.13 | 18.13 | 18.13 | 18.13 | 18.13 | 18.13 | 18.13 | 18.13 | 18.13 |
| EBITAT | 2,143.5 | 3,001.9 | 3,099.6 | 3,333.8 | 3,879.5 | 5,062.4 | 6,030.4 | 7,183.5 | 8,557.2 | 10,193.5 |
| Depreciation | ||||||||||
| Changes in Account Receivables | ||||||||||
| Changes in Inventories | ||||||||||
| Changes in Accounts Payable | ||||||||||
| Capital Expenditure | ||||||||||
| UFCF | -2,273.8 | -1,197.7 | 3,436.8 | 4,785.2 | 5,463.1 | 311.8 | 4,341.8 | 5,172.0 | 6,161.1 | 7,339.2 |
| WACC, % | 4.65 | 4.67 | 4.69 | 4.74 | 4.76 | 4.7 | 4.7 | 4.7 | 4.7 | 4.7 |
| PV UFCF | ||||||||||
| SUM PV UFCF | 19,724.6 | |||||||||
| Long Term Growth Rate, % | 4.00 | |||||||||
| Free cash flow (T + 1) | 7,633 | |||||||||
| Terminal Value | 1,089,112 | |||||||||
| Present Terminal Value | 865,610 | |||||||||
| Enterprise Value | 885,335 | |||||||||
| Net Debt | 1,217 | |||||||||
| Equity Value | 884,118 | |||||||||
| Diluted Shares Outstanding, MM | 31 | |||||||||
| Equity Value Per Share | 28,374.40 |
What Awaits You
- Flexible Forecast Inputs: Modify key assumptions (growth %, margins, WACC) effortlessly to generate various scenarios.
- Real-Time Financial Data: Mastek Limited’s financial information pre-loaded to expedite your analysis.
- Instant DCF Outputs: The template automatically computes Net Present Value (NPV) and intrinsic value for you.
- Tailored and Professional: A refined Excel model that can be customized to meet your valuation requirements.
- Designed for Analysts and Investors: Perfect for testing forecasts, confirming strategies, and enhancing efficiency.
Key Features
- Comprehensive Mastek Data: Pre-loaded with Mastek Limited’s historical financial metrics and future projections.
- Customizable Parameters: Modify revenue growth rates, profit margins, WACC, tax rates, and capital expenditure inputs.
- Interactive Valuation Model: Automatically refreshes Net Present Value (NPV) and intrinsic value as you adjust the variables.
- Scenario Analysis: Develop various forecasting scenarios to explore different valuation possibilities.
- Intuitive Interface: Designed for ease of use, catering to both seasoned professionals and newcomers.
How It Functions
- Download: Get the pre-built Excel file containing Mastek Limited’s (MASTEKNS) financial information.
- Customize: Modify projections such as revenue growth, EBITDA percentage, and WACC to fit your needs.
- Update Automatically: Enjoy real-time updates for intrinsic value and NPV calculations.
- Test Scenarios: Generate various forecasts and compare results instantly.
- Make Decisions: Leverage the valuation outcomes to inform your investment strategy.
Why Opt for This Calculator?
- All-in-One Solution: Combines DCF, WACC, and financial ratio evaluations into a single tool.
- Adjustable Parameters: Modify the highlighted fields to explore different scenarios.
- In-Depth Analysis: Automatically computes Mastek Limited’s intrinsic value and Net Present Value.
- Data Already Integrated: Features historical and projected data for precise starting values.
- High-Quality Standard: Perfect for financial analysts, investors, and business consultants.
Who Can Benefit from This Product?
- Finance Students: Master valuation methods and apply them using real-world data.
- Academics: Integrate professional valuation models into your courses or research projects.
- Investors: Validate your assumptions and evaluate valuation results for Mastek Limited (MASTEKNS) stock.
- Analysts: Enhance your efficiency with a ready-to-use, customizable DCF model.
- Small Business Owners: Discover how prominent public companies like Mastek Limited (MASTEKNS) are assessed.
Contents of the Template
- Operating and Balance Sheet Data: Pre-filled historical data and forecasts for Mastek Limited (MASTEKNS), including revenue, EBITDA, EBIT, and capital expenditures.
- WACC Calculation: A dedicated worksheet for calculating the Weighted Average Cost of Capital (WACC), featuring key parameters such as Beta, risk-free rate, and share price.
- DCF Valuation (Unlevered and Levered): Customizable Discounted Cash Flow models that illustrate intrinsic value along with comprehensive calculations.
- Financial Statements: Pre-loaded financial statements (annual and quarterly) to facilitate thorough analysis.
- Key Ratios: A collection of profitability, leverage, and efficiency ratios specific to Mastek Limited (MASTEKNS).
- Dashboard and Charts: A visual summary of valuation outputs and assumptions for easier analysis of results.
Disclaimer
All information, articles, and product details provided on this website are for general informational and educational purposes only. We do not claim any ownership over, nor do we intend to infringe upon, any trademarks, copyrights, logos, brand names, or other intellectual property mentioned or depicted on this site. Such intellectual property remains the property of its respective owners, and any references here are made solely for identification or informational purposes, without implying any affiliation, endorsement, or partnership.
We make no representations or warranties, express or implied, regarding the accuracy, completeness, or suitability of any content or products presented. Nothing on this website should be construed as legal, tax, investment, financial, medical, or other professional advice. In addition, no part of this site—including articles or product references—constitutes a solicitation, recommendation, endorsement, advertisement, or offer to buy or sell any securities, franchises, or other financial instruments, particularly in jurisdictions where such activity would be unlawful.
All content is of a general nature and may not address the specific circumstances of any individual or entity. It is not a substitute for professional advice or services. Any actions you take based on the information provided here are strictly at your own risk. You accept full responsibility for any decisions or outcomes arising from your use of this website and agree to release us from any liability in connection with your use of, or reliance upon, the content or products found herein.