
|
Avaliação DCF da MBIA Inc. (MBI) |
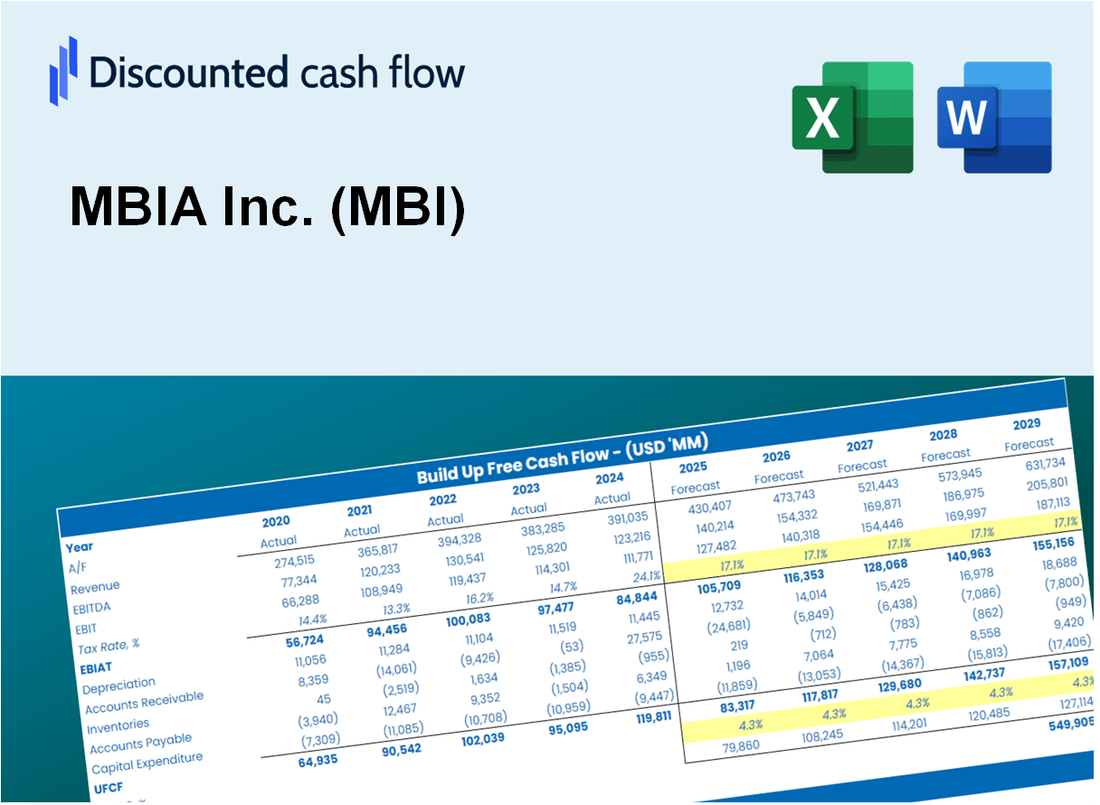
Totalmente Editável: Adapte-Se Às Suas Necessidades No Excel Ou Planilhas
Design Profissional: Modelos Confiáveis E Padrão Da Indústria
Pré-Construídos Para Uso Rápido E Eficiente
Compatível com MAC/PC, totalmente desbloqueado
Não É Necessária Experiência; Fácil De Seguir
MBIA Inc. (MBI) Bundle
Simplifique a avaliação da MBIA Inc. (MBI) com esta calculadora DCF personalizável! Com o Real MBIA Inc. (MBI) financeiras e insumos de previsão ajustáveis, você pode testar cenários e descobrir o valor justo da MBIA Inc. (MBI) em minutos.
What You Will Get
- Pre-Filled Financial Model: MBIA Inc.’s actual data allows for accurate DCF valuation.
- Full Forecast Control: Modify revenue growth, margins, WACC, and other essential factors.
- Instant Calculations: Automatic updates provide immediate results as you make adjustments.
- Investor-Ready Template: A polished Excel file crafted for professional-level valuation.
- Customizable and Reusable: Designed for adaptability, enabling repeated use for comprehensive forecasts.
Key Features
- Customizable Risk Metrics: Adjust essential inputs like default rates, recovery rates, and credit spreads.
- Instant Credit Analysis: Generates risk assessments, expected losses, and other key metrics in real-time.
- Industry-Leading Precision: Leverages MBIA Inc.’s (MBI) extensive historical data for accurate risk evaluations.
- Effortless Scenario Simulation: Evaluate various credit scenarios and analyze the impacts effortlessly.
- Efficiency Booster: Streamline the process by avoiding the creation of intricate risk models from the ground up.
How It Works
- 1. Access the Template: Download and open the Excel file containing MBIA Inc.'s (MBI) financial data.
- 2. Modify Key Inputs: Adjust essential parameters such as growth projections, WACC, and capital investments.
- 3. Analyze Results Immediately: The DCF model automatically computes intrinsic value and NPV.
- 4. Explore Different Scenarios: Evaluate various forecasts to understand different valuation results.
- 5. Present with Assurance: Deliver professional valuation analyses to back your strategic decisions.
Why Choose This Calculator for MBIA Inc. (MBI)?
- Accurate Data: Access to real MBIA financials ensures dependable valuation outcomes.
- Customizable: Tailor essential parameters like growth rates, WACC, and tax rates to align with your forecasts.
- Time-Saving: Pre-configured calculations save you the hassle of building from the ground up.
- Professional-Grade Tool: Crafted for investors, analysts, and financial consultants.
- User-Friendly: Easy-to-navigate design and clear instructions make it accessible for everyone.
Who Should Use MBIA Inc. (MBI)?
- Finance Students: Understand credit risk management and apply concepts using real-world data.
- Academics: Utilize industry models in your research or teaching related to financial services.
- Investors: Evaluate your investment strategies and analyze the financial health of MBIA Inc. (MBI).
- Analysts: Enhance your analysis with a customizable framework for assessing bond insurance.
- Small Business Owners: Learn about the impact of credit ratings and insurance on business financing.
What the Template Contains
- Historical Data: Includes MBIA Inc.’s past financials and baseline forecasts.
- DCF and Levered DCF Models: Detailed templates to calculate MBIA Inc.’s intrinsic value.
- WACC Sheet: Pre-built calculations for Weighted Average Cost of Capital.
- Editable Inputs: Modify key drivers like growth rates, EBITDA %, and CAPEX assumptions.
- Quarterly and Annual Statements: A complete breakdown of MBIA Inc.’s financials.
- Interactive Dashboard: Visualize valuation results and projections dynamically.
Disclaimer
All information, articles, and product details provided on this website are for general informational and educational purposes only. We do not claim any ownership over, nor do we intend to infringe upon, any trademarks, copyrights, logos, brand names, or other intellectual property mentioned or depicted on this site. Such intellectual property remains the property of its respective owners, and any references here are made solely for identification or informational purposes, without implying any affiliation, endorsement, or partnership.
We make no representations or warranties, express or implied, regarding the accuracy, completeness, or suitability of any content or products presented. Nothing on this website should be construed as legal, tax, investment, financial, medical, or other professional advice. In addition, no part of this site—including articles or product references—constitutes a solicitation, recommendation, endorsement, advertisement, or offer to buy or sell any securities, franchises, or other financial instruments, particularly in jurisdictions where such activity would be unlawful.
All content is of a general nature and may not address the specific circumstances of any individual or entity. It is not a substitute for professional advice or services. Any actions you take based on the information provided here are strictly at your own risk. You accept full responsibility for any decisions or outcomes arising from your use of this website and agree to release us from any liability in connection with your use of, or reliance upon, the content or products found herein.