
|
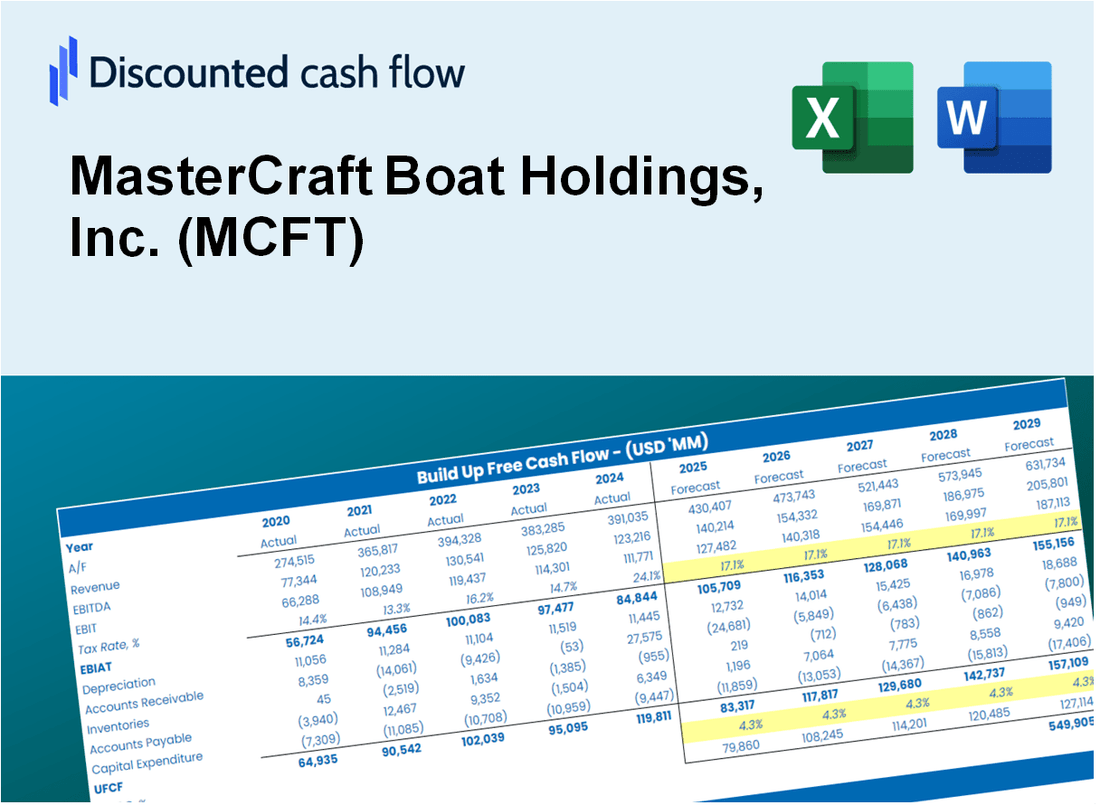
Avaliação DCF de Mastercraft Boat Holdings, Inc. (MCFT) |
Totalmente Editável: Adapte-Se Às Suas Necessidades No Excel Ou Planilhas
Design Profissional: Modelos Confiáveis E Padrão Da Indústria
Pré-Construídos Para Uso Rápido E Eficiente
Compatível com MAC/PC, totalmente desbloqueado
Não É Necessária Experiência; Fácil De Seguir
MasterCraft Boat Holdings, Inc. (MCFT) Bundle
Aprimore suas opções de investimento com a calculadora DCF de Mastercraft Boat Holdings, Inc. (MCFT)! Utilize dados financeiros reais para mastercraft, ajuste as projeções e despesas de crescimento e observe instantaneamente como essas alterações afetam o valor intrínseco do MCFT.
Discounted Cash Flow (DCF) - (USD MM)
| Year | AY1 2021 |
AY2 2022 |
AY3 2023 |
AY4 2024 |
AY5 2025 |
FY1 2026 |
FY2 2027 |
FY3 2028 |
FY4 2029 |
FY5 2030 |
|---|---|---|---|---|---|---|---|---|---|---|
| Revenue | 466.0 | 641.6 | 609.9 | 366.6 | 284.2 | 263.2 | 243.7 | 225.6 | 208.9 | 193.5 |
| Revenue Growth, % | 0 | 37.7 | -4.94 | -39.89 | -22.47 | -7.4 | -7.4 | -7.4 | -7.4 | -7.4 |
| EBITDA | 86.3 | 125.9 | 133.2 | 24.6 | 24.3 | 39.6 | 36.7 | 34.0 | 31.4 | 29.1 |
| EBITDA, % | 18.52 | 19.63 | 21.84 | 6.71 | 8.54 | 15.05 | 15.05 | 15.05 | 15.05 | 15.05 |
| Depreciation | 8.4 | 9.7 | 8.4 | 11.2 | 9.6 | 5.8 | 5.4 | 5.0 | 4.6 | 4.3 |
| Depreciation, % | 1.8 | 1.52 | 1.38 | 3.05 | 3.37 | 2.22 | 2.22 | 2.22 | 2.22 | 2.22 |
| EBIT | 77.9 | 116.2 | 124.8 | 13.4 | 14.7 | 33.8 | 31.3 | 28.9 | 26.8 | 24.8 |
| EBIT, % | 16.72 | 18.11 | 20.46 | 3.66 | 5.17 | 12.82 | 12.82 | 12.82 | 12.82 | 12.82 |
| Total Cash | 39.3 | 34.2 | 111.4 | 86.2 | 79.4 | 43.9 | 40.7 | 37.7 | 34.9 | 32.3 |
| Total Cash, percent | .0 | .0 | .0 | .0 | .0 | .0 | .0 | .0 | .0 | .0 |
| Account Receivables | 12.4 | 22.5 | 15.7 | 12.0 | 4.3 | 7.1 | 6.6 | 6.1 | 5.7 | 5.2 |
| Account Receivables, % | 2.67 | 3.5 | 2.58 | 3.26 | 1.51 | 2.7 | 2.7 | 2.7 | 2.7 | 2.7 |
| Inventories | 53.5 | 58.6 | 58.3 | 37.0 | 30.5 | 26.8 | 24.8 | 23.0 | 21.3 | 19.7 |
| Inventories, % | 11.48 | 9.13 | 9.56 | 10.09 | 10.72 | 10.19 | 10.19 | 10.19 | 10.19 | 10.19 |
| Accounts Payable | 23.9 | 23.4 | 20.4 | 10.4 | 8.3 | 9.4 | 8.7 | 8.1 | 7.5 | 6.9 |
| Accounts Payable, % | 5.12 | 3.64 | 3.34 | 2.85 | 2.9 | 3.57 | 3.57 | 3.57 | 3.57 | 3.57 |
| Capital Expenditure | -27.9 | -12.3 | -24.6 | -16.4 | -9.2 | -10.3 | -9.6 | -8.9 | -8.2 | -7.6 |
| Capital Expenditure, % | -5.98 | -1.92 | -4.03 | -4.46 | -3.24 | -3.92 | -3.92 | -3.92 | -3.92 | -3.92 |
| Tax Rate, % | 47.96 | 47.96 | 47.96 | 47.96 | 47.96 | 47.96 | 47.96 | 47.96 | 47.96 | 47.96 |
| EBITAT | 58.7 | 59.0 | 70.4 | 10.3 | 7.7 | 21.0 | 19.5 | 18.0 | 16.7 | 15.5 |
| Depreciation | ||||||||||
| Changes in Account Receivables | ||||||||||
| Changes in Inventories | ||||||||||
| Changes in Accounts Payable | ||||||||||
| Capital Expenditure | ||||||||||
| UFCF | -2.8 | 40.8 | 58.3 | 20.3 | 20.0 | 18.5 | 17.1 | 15.9 | 14.7 | 13.6 |
| WACC, % | 8.86 | 8.86 | 8.86 | 8.86 | 8.86 | 8.86 | 8.86 | 8.86 | 8.86 | 8.86 |
| PV UFCF | ||||||||||
| SUM PV UFCF | 63.2 | |||||||||
| Long Term Growth Rate, % | 0.50 | |||||||||
| Free cash flow (T + 1) | 14 | |||||||||
| Terminal Value | 164 | |||||||||
| Present Terminal Value | 107 | |||||||||
| Enterprise Value | 170 | |||||||||
| Net Debt | -29 | |||||||||
| Equity Value | 199 | |||||||||
| Diluted Shares Outstanding, MM | 17 | |||||||||
| Equity Value Per Share | 12.04 |
What You Will Get
- Editable Excel Template: A fully customizable Excel-based DCF Calculator featuring pre-filled real MCFT financials.
- Real-World Data: Historical data and forward-looking estimates (as highlighted in the yellow cells).
- Forecast Flexibility: Adjust forecast assumptions such as revenue growth, EBITDA %, and WACC.
- Automatic Calculations: Instantly observe the effect of your inputs on MasterCraft's valuation.
- Professional Tool: Designed for investors, CFOs, consultants, and financial analysts.
- User-Friendly Design: Organized for clarity and ease of use, complete with step-by-step instructions.
Key Features
- Comprehensive Historical Data: MasterCraft Boat Holdings, Inc.'s (MCFT) past financial statements and projected forecasts are readily available.
- Customizable Parameters: Modify WACC, tax rates, revenue growth, and EBITDA margins to suit your analysis.
- Real-Time Valuation: Instantly view the recalculated intrinsic value of MasterCraft Boat Holdings, Inc. (MCFT).
- Intuitive Visuals: Engaging dashboard charts present valuation outcomes and essential metrics clearly.
- Precision Engineered: A reliable resource tailored for analysts, investors, and finance professionals.
How It Works
- Step 1: Download the prebuilt Excel template featuring MasterCraft Boat Holdings, Inc. (MCFT) data included.
- Step 2: Navigate through the pre-filled sheets to familiarize yourself with the essential metrics.
- Step 3: Modify forecasts and assumptions in the editable yellow cells (WACC, growth, margins).
- Step 4: Immediately view updated results, including MasterCraft's intrinsic value.
- Step 5: Make informed investment decisions or create reports based on the generated outputs.
Why Choose This Calculator?
- User-Friendly Interface: Perfect for both novices and seasoned professionals.
- Customizable Inputs: Adjust parameters easily to suit your financial analysis.
- Real-Time Feedback: Observe immediate changes to MasterCraft Boat Holdings, Inc. (MCFT)'s valuation as you tweak inputs.
- Preloaded Data: Comes with MasterCraft's actual financial figures for swift evaluations.
- Relied Upon by Experts: A go-to tool for investors and analysts seeking to make well-informed choices.
Who Should Use This Product?
- Marine Enthusiasts: Discover the intricacies of boat design and performance using real-world data.
- Academics: Integrate industry-specific models into your studies or research projects.
- Investors: Validate your investment strategies and evaluate valuation metrics for MasterCraft Boat Holdings, Inc. (MCFT).
- Analysts: Enhance your analysis process with a customizable financial model tailored for the boating industry.
- Small Business Owners: Understand how major players like MasterCraft Boat Holdings, Inc. (MCFT) are assessed in the market.
What the Template Contains
- Historical Data: Includes MasterCraft Boat Holdings, Inc.'s (MCFT) past financials and baseline forecasts.
- DCF and Levered DCF Models: Detailed templates to calculate MasterCraft's intrinsic value.
- WACC Sheet: Pre-built calculations for Weighted Average Cost of Capital.
- Editable Inputs: Modify key drivers like growth rates, EBITDA %, and CAPEX assumptions.
- Quarterly and Annual Statements: A complete breakdown of MasterCraft's financials.
- Interactive Dashboard: Visualize valuation results and projections dynamically.
Disclaimer
All information, articles, and product details provided on this website are for general informational and educational purposes only. We do not claim any ownership over, nor do we intend to infringe upon, any trademarks, copyrights, logos, brand names, or other intellectual property mentioned or depicted on this site. Such intellectual property remains the property of its respective owners, and any references here are made solely for identification or informational purposes, without implying any affiliation, endorsement, or partnership.
We make no representations or warranties, express or implied, regarding the accuracy, completeness, or suitability of any content or products presented. Nothing on this website should be construed as legal, tax, investment, financial, medical, or other professional advice. In addition, no part of this site—including articles or product references—constitutes a solicitation, recommendation, endorsement, advertisement, or offer to buy or sell any securities, franchises, or other financial instruments, particularly in jurisdictions where such activity would be unlawful.
All content is of a general nature and may not address the specific circumstances of any individual or entity. It is not a substitute for professional advice or services. Any actions you take based on the information provided here are strictly at your own risk. You accept full responsibility for any decisions or outcomes arising from your use of this website and agree to release us from any liability in connection with your use of, or reliance upon, the content or products found herein.