
|
Mishra Dhatu Nigam Limited (Midhani.NS) DCF Avaliação |
Totalmente Editável: Adapte-Se Às Suas Necessidades No Excel Ou Planilhas
Design Profissional: Modelos Confiáveis E Padrão Da Indústria
Pré-Construídos Para Uso Rápido E Eficiente
Compatível com MAC/PC, totalmente desbloqueado
Não É Necessária Experiência; Fácil De Seguir
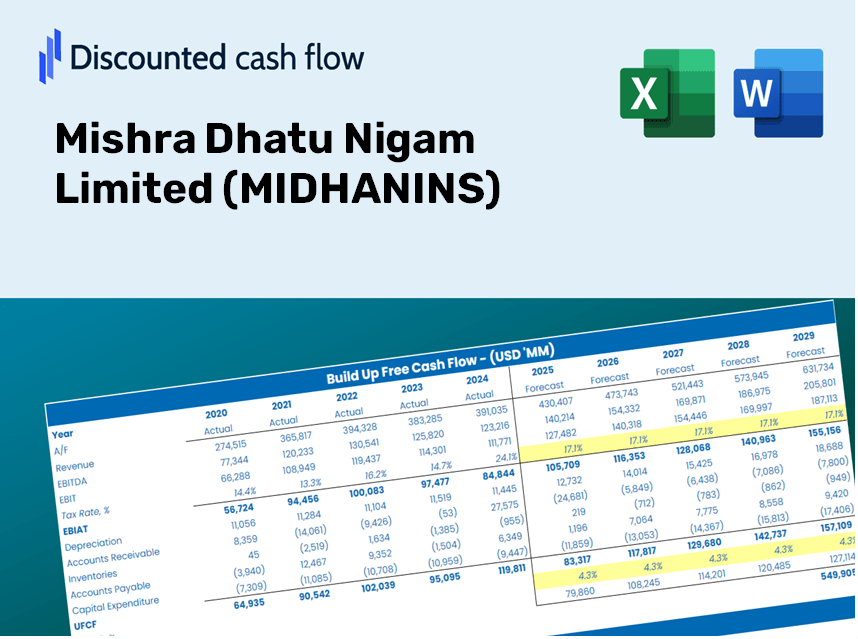
Mishra Dhatu Nigam Limited (MIDHANI.NS) Bundle
Simplifique sua análise e aumente a precisão com a nossa calculadora DCF (Midhanins)! Utilizando dados autênticos da Mishra Dhatu Nigam Limited e suposições personalizáveis, essa ferramenta permite prever, analisar e valorizar Mishra Dhatu Nigam Limited como um investidor experiente.
Discounted Cash Flow (DCF) - (USD MM)
| Year | AY1 2021 |
AY2 2022 |
AY3 2023 |
AY4 2024 |
AY5 2025 |
FY1 2026 |
FY2 2027 |
FY3 2028 |
FY4 2029 |
FY5 2030 |
|---|---|---|---|---|---|---|---|---|---|---|
| Revenue | 8,132.3 | 8,594.9 | 8,719.4 | 10,726.7 | 10,741.0 | 11,554.4 | 12,429.4 | 13,370.7 | 14,383.2 | 15,472.4 |
| Revenue Growth, % | 0 | 5.69 | 1.45 | 23.02 | 0.13303 | 7.57 | 7.57 | 7.57 | 7.57 | 7.57 |
| EBITDA | 2,657.8 | 2,946.8 | 2,964.6 | 2,249.7 | 2,489.7 | 3,353.5 | 3,607.5 | 3,880.7 | 4,174.6 | 4,490.7 |
| EBITDA, % | 32.68 | 34.29 | 34 | 20.97 | 23.18 | 29.02 | 29.02 | 29.02 | 29.02 | 29.02 |
| Depreciation | 270.0 | 330.0 | 530.0 | 585.5 | 634.8 | 568.6 | 611.7 | 658.0 | 707.8 | 761.4 |
| Depreciation, % | 3.32 | 3.84 | 6.08 | 5.46 | 5.91 | 4.92 | 4.92 | 4.92 | 4.92 | 4.92 |
| EBIT | 2,387.8 | 2,616.9 | 2,434.6 | 1,664.2 | 1,854.9 | 2,784.9 | 2,995.8 | 3,222.7 | 3,466.8 | 3,729.3 |
| EBIT, % | 29.36 | 30.45 | 27.92 | 15.51 | 17.27 | 24.1 | 24.1 | 24.1 | 24.1 | 24.1 |
| Total Cash | 938.7 | 624.8 | 142.9 | 164.8 | 510.2 | 617.9 | 664.6 | 715.0 | 769.1 | 827.4 |
| Total Cash, percent | .0 | .0 | .0 | .0 | .0 | .0 | .0 | .0 | .0 | .0 |
| Account Receivables | 3,861.4 | 3,063.1 | 3,158.0 | 3,230.0 | 4,103.1 | 4,336.4 | 4,664.8 | 5,018.0 | 5,398.0 | 5,806.8 |
| Account Receivables, % | 47.48 | 35.64 | 36.22 | 30.11 | 38.2 | 37.53 | 37.53 | 37.53 | 37.53 | 37.53 |
| Inventories | 8,008.4 | 10,914.9 | 12,248.4 | 13,097.2 | 12,809.8 | 11,519.2 | 12,391.5 | 13,329.9 | 14,339.4 | 15,425.3 |
| Inventories, % | 98.48 | 126.99 | 140.47 | 122.1 | 119.26 | 99.7 | 99.7 | 99.7 | 99.7 | 99.7 |
| Accounts Payable | 855.7 | 1,758.8 | 1,457.8 | 1,199.7 | 932.7 | 1,561.5 | 1,679.8 | 1,807.0 | 1,943.8 | 2,091.0 |
| Accounts Payable, % | 10.52 | 20.46 | 16.72 | 11.18 | 8.68 | 13.51 | 13.51 | 13.51 | 13.51 | 13.51 |
| Capital Expenditure | -1,592.5 | -905.9 | -729.0 | -793.2 | -676.9 | -1,205.8 | -1,297.1 | -1,395.4 | -1,501.0 | -1,614.7 |
| Capital Expenditure, % | -19.58 | -10.54 | -8.36 | -7.39 | -6.3 | -10.44 | -10.44 | -10.44 | -10.44 | -10.44 |
| Tax Rate, % | 28.97 | 28.97 | 28.97 | 28.97 | 28.97 | 28.97 | 28.97 | 28.97 | 28.97 | 28.97 |
| EBITAT | 1,756.6 | 1,930.4 | 1,753.7 | 1,161.7 | 1,317.5 | 2,006.3 | 2,158.2 | 2,321.6 | 2,497.5 | 2,686.6 |
| Depreciation | ||||||||||
| Changes in Account Receivables | ||||||||||
| Changes in Inventories | ||||||||||
| Changes in Accounts Payable | ||||||||||
| Capital Expenditure | ||||||||||
| UFCF | -10,580.0 | 149.2 | -174.8 | -224.8 | 422.6 | 3,055.3 | 390.3 | 419.8 | 451.6 | 485.8 |
| WACC, % | 4.76 | 4.76 | 4.75 | 4.74 | 4.75 | 4.75 | 4.75 | 4.75 | 4.75 | 4.75 |
| PV UFCF | ||||||||||
| SUM PV UFCF | 4,397.9 | |||||||||
| Long Term Growth Rate, % | 4.00 | |||||||||
| Free cash flow (T + 1) | 505 | |||||||||
| Terminal Value | 67,208 | |||||||||
| Present Terminal Value | 53,286 | |||||||||
| Enterprise Value | 57,684 | |||||||||
| Net Debt | 2,987 | |||||||||
| Equity Value | 54,697 | |||||||||
| Diluted Shares Outstanding, MM | 188 | |||||||||
| Equity Value Per Share | 291.44 |
Benefits You Will Receive
- Customizable Excel Template: A fully adjustable Excel-based DCF Calculator featuring pre-filled actual financials for MIDHANINS (Mishra Dhatu Nigam Limited).
- Accurate Data: Historical performance data and forward-looking projections (highlighted in the yellow cells).
- Flexible Forecasting: Modify key assumptions such as revenue growth, EBITDA percentage, and WACC.
- Instant Calculations: Quickly visualize how your inputs affect the valuation of MIDHANINS (Mishra Dhatu Nigam Limited).
- Professional Resource: Designed for investors, CFOs, consultants, and financial analysts seeking insights.
- User-Friendly Interface: Organized for ease of understanding and navigation, complete with step-by-step guidance.
Key Features
- Comprehensive DCF Calculator: Features detailed unlevered and levered DCF valuation frameworks for accurate analysis.
- WACC Calculator: Pre-designed Weighted Average Cost of Capital template with adjustable inputs tailored for Mishra Dhatu Nigam Limited (MIDHANINS).
- Customizable Forecast Assumptions: Easily modify parameters such as growth rates, capital expenditures, and discount rates.
- Integrated Financial Ratios: Evaluate profitability, leverage, and efficiency ratios relevant to Mishra Dhatu Nigam Limited (MIDHANINS).
- User-Friendly Dashboard and Charts: Visual representations that encapsulate essential valuation metrics for straightforward analysis.
How It Works
- Step 1: Download the Excel file for Mishra Dhatu Nigam Limited (MIDHANINS).
- Step 2: Examine the pre-filled financial data and forecasts provided by MIDHANINS.
- Step 3: Adjust key inputs such as revenue growth, WACC, and tax rates (highlighted cells).
- Step 4: Observe the DCF model refresh in real-time as you modify your assumptions.
- Step 5: Review the outputs and leverage the results for your investment strategies.
Why Opt for This Calculator?
- Designed for Experts: A sophisticated tool utilized by analysts, CFOs, and industry consultants.
- Authentic Data: MIDHANINS’s historical and projected financial metrics are preloaded for precise calculations.
- Scenario Analysis: Easily test various forecasts and assumptions to evaluate outcomes.
- Transparent Results: Automatically computes intrinsic value, NPV, and essential financial metrics.
- User-Friendly: Comprehensive step-by-step instructions make the process straightforward.
Who Can Benefit from This Product?
- Investors: Assess the valuation of Mishra Dhatu Nigam Limited (MIDHANINS) prior to making investment decisions.
- Financial Executives and Analysts: Enhance valuation methodologies and evaluate financial projections.
- Entrepreneurs: Discover how prominent companies like Mishra Dhatu Nigam Limited (MIDHANINS) are valued.
- Consultants: Provide comprehensive valuation analyses and reports for your clients.
- Students and Educators: Utilize real-time data for practicing and teaching valuation strategies.
Contents of the Template
- In-Depth DCF Model: Editable template featuring comprehensive valuation calculations.
- Real-World Data: MIDHANINS’s historical and projected financials preloaded for your analysis.
- Customizable Parameters: Modify WACC, growth rates, and tax assumptions to explore various scenarios.
- Financial Statements: Detailed annual and quarterly breakdowns for enhanced insights.
- Key Ratios: Integrated analysis for profitability, efficiency, and leverage metrics.
- Dashboard with Visual Outputs: Graphs and tables providing clear, actionable insights.
Disclaimer
All information, articles, and product details provided on this website are for general informational and educational purposes only. We do not claim any ownership over, nor do we intend to infringe upon, any trademarks, copyrights, logos, brand names, or other intellectual property mentioned or depicted on this site. Such intellectual property remains the property of its respective owners, and any references here are made solely for identification or informational purposes, without implying any affiliation, endorsement, or partnership.
We make no representations or warranties, express or implied, regarding the accuracy, completeness, or suitability of any content or products presented. Nothing on this website should be construed as legal, tax, investment, financial, medical, or other professional advice. In addition, no part of this site—including articles or product references—constitutes a solicitation, recommendation, endorsement, advertisement, or offer to buy or sell any securities, franchises, or other financial instruments, particularly in jurisdictions where such activity would be unlawful.
All content is of a general nature and may not address the specific circumstances of any individual or entity. It is not a substitute for professional advice or services. Any actions you take based on the information provided here are strictly at your own risk. You accept full responsibility for any decisions or outcomes arising from your use of this website and agree to release us from any liability in connection with your use of, or reliance upon, the content or products found herein.