
|
Melco Resorts & Avaliação DCF de Entertainment Limited (MLCO) |
Totalmente Editável: Adapte-Se Às Suas Necessidades No Excel Ou Planilhas
Design Profissional: Modelos Confiáveis E Padrão Da Indústria
Pré-Construídos Para Uso Rápido E Eficiente
Compatível com MAC/PC, totalmente desbloqueado
Não É Necessária Experiência; Fácil De Seguir
Melco Resorts & Entertainment Limited (MLCO) Bundle
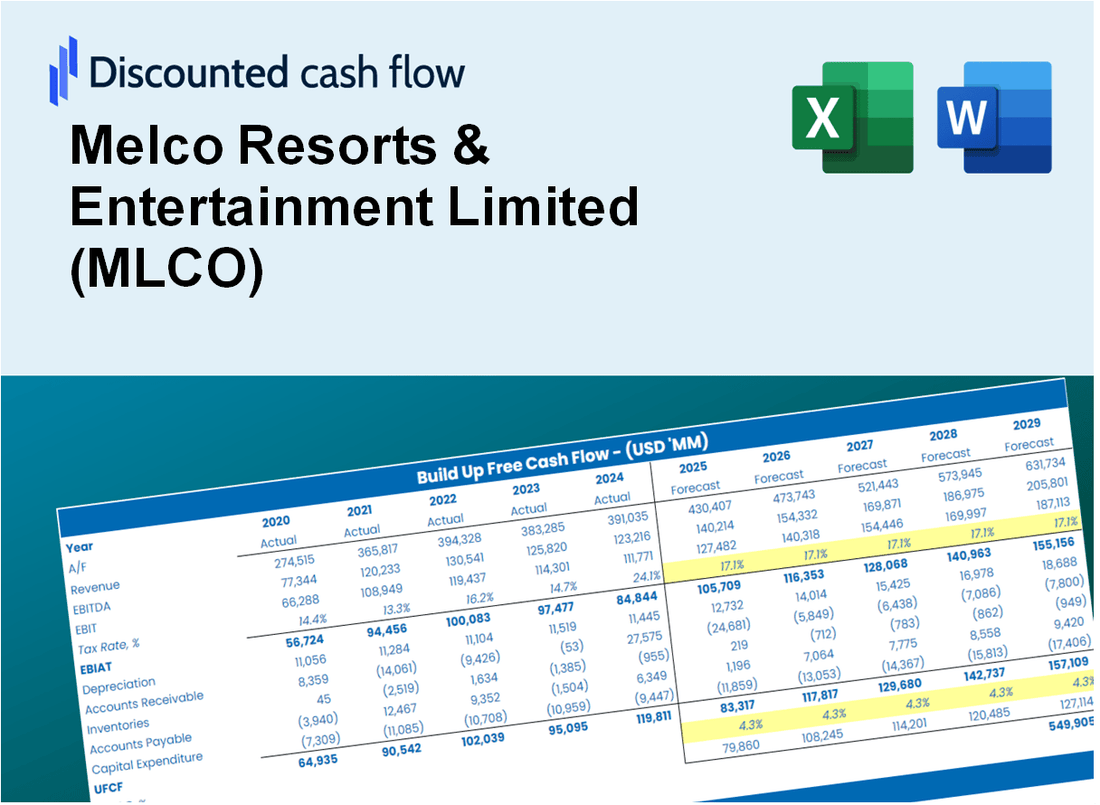
Procurando avaliar o valor intrínseco de Melco Resorts & Entertainment Limited? Nossa calculadora DCF (MLCO) integra dados do mundo real com recursos abrangentes de personalização, permitindo adaptar as previsões e aprimorar suas estratégias de investimento.
Discounted Cash Flow (DCF) - (USD MM)
| Year | AY1 2020 |
AY2 2021 |
AY3 2022 |
AY4 2023 |
AY5 2024 |
FY1 2025 |
FY2 2026 |
FY3 2027 |
FY4 2028 |
FY5 2029 |
|---|---|---|---|---|---|---|---|---|---|---|
| Revenue | 1,727.9 | 2,012.4 | 1,350.0 | 3,775.2 | 4,638.2 | 5,872.0 | 7,434.0 | 9,411.6 | 11,915.1 | 15,084.7 |
| Revenue Growth, % | 0 | 16.46 | -32.92 | 179.65 | 22.86 | 26.6 | 26.6 | 26.6 | 26.6 | 26.6 |
| EBITDA | -300.0 | -23.2 | -217.6 | 816.0 | 1,021.9 | 105.9 | 134.0 | 169.7 | 214.8 | 271.9 |
| EBITDA, % | -17.36 | -1.15 | -16.12 | 21.61 | 22.03 | 1.8 | 1.8 | 1.8 | 1.8 | 1.8 |
| Depreciation | 618.5 | 579.8 | 521.9 | 543.4 | 541.5 | 1,519.0 | 1,923.1 | 2,434.6 | 3,082.3 | 3,902.2 |
| Depreciation, % | 35.8 | 28.81 | 38.66 | 14.39 | 11.68 | 25.87 | 25.87 | 25.87 | 25.87 | 25.87 |
| EBIT | -918.6 | -603.0 | -739.5 | 272.6 | 480.4 | -1,413.2 | -1,789.1 | -2,265.0 | -2,867.5 | -3,630.3 |
| EBIT, % | -53.16 | -29.97 | -54.78 | 7.22 | 10.36 | -24.07 | -24.07 | -24.07 | -24.07 | -24.07 |
| Total Cash | 1,755.4 | 1,652.9 | 1,812.7 | 1,310.7 | 1,147.2 | 4,011.6 | 5,078.8 | 6,429.8 | 8,140.2 | 10,305.5 |
| Total Cash, percent | .0 | .0 | .0 | .0 | .0 | .0 | .0 | .0 | .0 | .0 |
| Account Receivables | 130.4 | 54.9 | 56.6 | 92.4 | 146.6 | 235.8 | 298.5 | 377.9 | 478.4 | 605.7 |
| Account Receivables, % | 7.55 | 2.73 | 4.19 | 2.45 | 3.16 | 4.02 | 4.02 | 4.02 | 4.02 | 4.02 |
| Inventories | 37.3 | 29.6 | 26.4 | 29.4 | 32.5 | 83.0 | 105.0 | 133.0 | 168.3 | 213.1 |
| Inventories, % | 2.16 | 1.47 | 1.96 | 0.77947 | 0.69967 | 1.41 | 1.41 | 1.41 | 1.41 | 1.41 |
| Accounts Payable | 9.5 | 6.0 | 6.7 | 11.8 | 24.8 | 25.7 | 32.6 | 41.2 | 52.2 | 66.1 |
| Accounts Payable, % | 0.54881 | 0.29776 | 0.49853 | 0.31129 | 0.53456 | 0.43819 | 0.43819 | 0.43819 | 0.43819 | 0.43819 |
| Capital Expenditure | -463.9 | -679.4 | -622.1 | -263.9 | -301.2 | -1,411.3 | -1,786.7 | -2,262.0 | -2,863.7 | -3,625.5 |
| Capital Expenditure, % | -26.85 | -33.76 | -46.08 | -6.99 | -6.49 | -24.03 | -24.03 | -24.03 | -24.03 | -24.03 |
| Tax Rate, % | 785.82 | 785.82 | 785.82 | 785.82 | 785.82 | 785.82 | 785.82 | 785.82 | 785.82 | 785.82 |
| EBITAT | -796.3 | -513.3 | -630.2 | 221.7 | -3,294.5 | -956.4 | -1,210.7 | -1,532.8 | -1,940.6 | -2,456.8 |
| Depreciation | ||||||||||
| Changes in Account Receivables | ||||||||||
| Changes in Inventories | ||||||||||
| Changes in Accounts Payable | ||||||||||
| Capital Expenditure | ||||||||||
| UFCF | -799.8 | -533.2 | -728.2 | 467.4 | -3,098.3 | -987.4 | -1,152.3 | -1,458.9 | -1,846.9 | -2,338.2 |
| WACC, % | 5.72 | 5.63 | 5.63 | 5.39 | 0.37534 | 4.55 | 4.55 | 4.55 | 4.55 | 4.55 |
| PV UFCF | ||||||||||
| SUM PV UFCF | -6,693.1 | |||||||||
| Long Term Growth Rate, % | 2.00 | |||||||||
| Free cash flow (T + 1) | -2,385 | |||||||||
| Terminal Value | -93,575 | |||||||||
| Present Terminal Value | -74,914 | |||||||||
| Enterprise Value | -81,607 | |||||||||
| Net Debt | 6,309 | |||||||||
| Equity Value | -87,916 | |||||||||
| Diluted Shares Outstanding, MM | 48 | |||||||||
| Equity Value Per Share | -1,826.75 |
What You Will Receive
- Authentic MLCO Financial Data: Pre-filled with Melco Resorts’ historical and projected data for accurate analysis.
- Completely Customizable Template: Easily adjust key inputs such as revenue growth, WACC, and EBITDA %.
- Instant Calculations: Witness Melco Resorts' intrinsic value update in real-time as you make changes.
- Professional Valuation Tool: Tailored for investors, analysts, and consultants aiming for precise DCF outcomes.
- User-Friendly Interface: Intuitive layout and straightforward instructions suitable for all skill levels.
Key Features
- Real-Life MLCO Data: Pre-filled with Melco Resorts & Entertainment Limited’s historical financials and future projections.
- Fully Customizable Inputs: Modify revenue growth, profit margins, WACC, tax rates, and capital expenditures to suit your analysis.
- Dynamic Valuation Model: Automatic recalculations of Net Present Value (NPV) and intrinsic value based on your specified inputs.
- Scenario Testing: Develop various forecast scenarios to explore different valuation results.
- User-Friendly Design: Intuitive, organized, and tailored for both professionals and newcomers.
How It Works
- 1. Access the Template: Download and open the Excel file containing Melco Resorts & Entertainment Limited’s (MLCO) preloaded data.
- 2. Modify Assumptions: Adjust essential inputs such as growth rates, WACC, and capital expenditures.
- 3. View Results Instantly: The DCF model automatically calculates intrinsic value and NPV in real-time.
- 4. Explore Scenarios: Analyze various forecasts to evaluate different valuation results.
- 5. Present with Confidence: Deliver professional valuation insights to enhance your decision-making.
Why Choose Melco Resorts & Entertainment Limited (MLCO)?
- Exceptional Experience: Enjoy world-class entertainment and hospitality in premier destinations.
- Strong Financial Performance: Benefit from a company with a proven track record of profitability and growth.
- Innovative Offerings: Explore cutting-edge facilities and unique attractions that set us apart.
- Sustainable Practices: Committed to responsible tourism and environmental stewardship.
- Expert Leadership: Led by a team of industry veterans dedicated to excellence and customer satisfaction.
Who Should Use This Product?
- Investors: Accurately assess Melco Resorts & Entertainment Limited’s (MLCO) fair value prior to making investment choices.
- CFOs: Utilize a top-tier DCF model for comprehensive financial reporting and analysis.
- Consultants: Efficiently customize the template for valuation reports tailored to clients.
- Entrepreneurs: Acquire knowledge of financial modeling techniques employed by leading companies in the entertainment sector.
- Educators: Implement it as a teaching resource to illustrate various valuation methodologies.
What the Template Contains
- Historical Data: Includes Melco Resorts & Entertainment Limited’s (MLCO) past financials and baseline forecasts.
- DCF and Levered DCF Models: Detailed templates to calculate Melco’s intrinsic value.
- WACC Sheet: Pre-built calculations for Weighted Average Cost of Capital.
- Editable Inputs: Modify key drivers like growth rates, EBITDA %, and CAPEX assumptions.
- Quarterly and Annual Statements: A complete breakdown of Melco’s financials.
- Interactive Dashboard: Visualize valuation results and projections dynamically.
Disclaimer
All information, articles, and product details provided on this website are for general informational and educational purposes only. We do not claim any ownership over, nor do we intend to infringe upon, any trademarks, copyrights, logos, brand names, or other intellectual property mentioned or depicted on this site. Such intellectual property remains the property of its respective owners, and any references here are made solely for identification or informational purposes, without implying any affiliation, endorsement, or partnership.
We make no representations or warranties, express or implied, regarding the accuracy, completeness, or suitability of any content or products presented. Nothing on this website should be construed as legal, tax, investment, financial, medical, or other professional advice. In addition, no part of this site—including articles or product references—constitutes a solicitation, recommendation, endorsement, advertisement, or offer to buy or sell any securities, franchises, or other financial instruments, particularly in jurisdictions where such activity would be unlawful.
All content is of a general nature and may not address the specific circumstances of any individual or entity. It is not a substitute for professional advice or services. Any actions you take based on the information provided here are strictly at your own risk. You accept full responsibility for any decisions or outcomes arising from your use of this website and agree to release us from any liability in connection with your use of, or reliance upon, the content or products found herein.