
|
Avaliação DCF MeridianLink, Inc. (MLNK) |
Totalmente Editável: Adapte-Se Às Suas Necessidades No Excel Ou Planilhas
Design Profissional: Modelos Confiáveis E Padrão Da Indústria
Pré-Construídos Para Uso Rápido E Eficiente
Compatível com MAC/PC, totalmente desbloqueado
Não É Necessária Experiência; Fácil De Seguir
MeridianLink, Inc. (MLNK) Bundle
Procurando avaliar o valor intrínseco da MeridianLink, Inc.? Nossa calculadora DCF (MLNK) integra dados do mundo real com extensos recursos de personalização, permitindo refinar suas previsões e aprimorar suas opções de investimento.
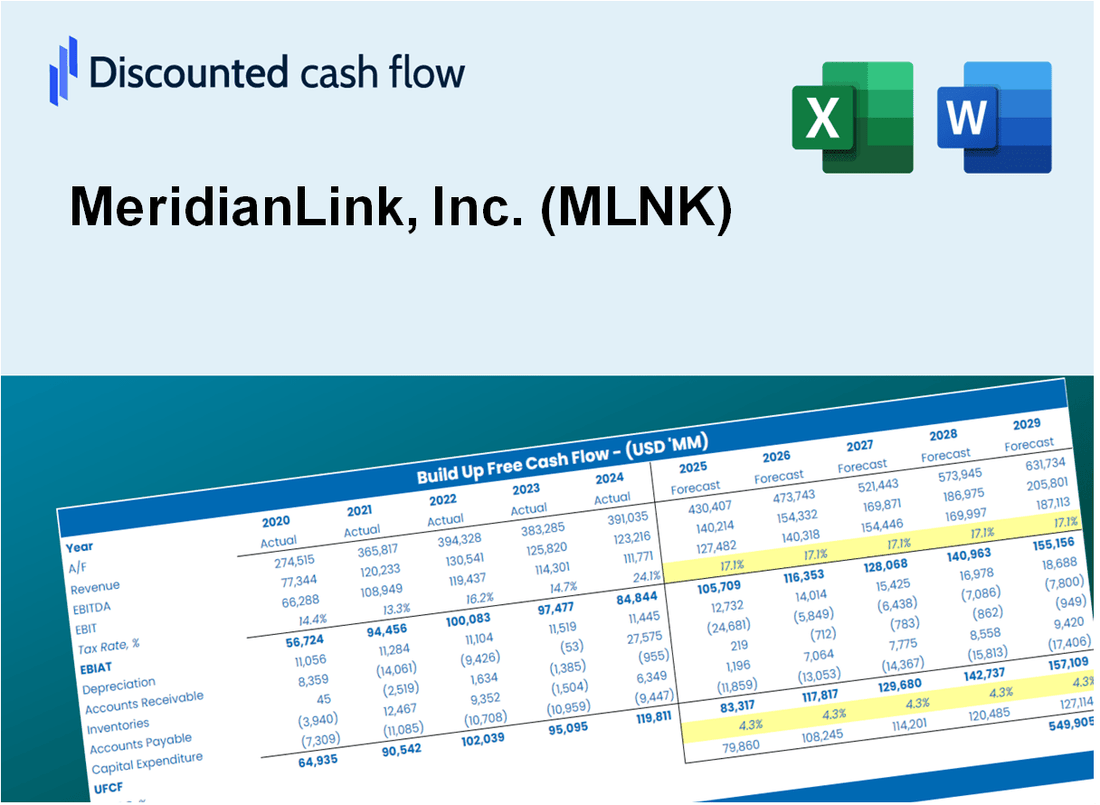
Discounted Cash Flow (DCF) - (USD MM)
| Year | AY1 2020 |
AY2 2021 |
AY3 2022 |
AY4 2023 |
AY5 2024 |
FY1 2025 |
FY2 2026 |
FY3 2027 |
FY4 2028 |
FY5 2029 |
|---|---|---|---|---|---|---|---|---|---|---|
| Revenue | 199.3 | 267.7 | 288.0 | 303.6 | 316.3 | 357.0 | 402.9 | 454.8 | 513.3 | 579.4 |
| Revenue Growth, % | 0 | 34.28 | 7.61 | 5.41 | 4.18 | 12.87 | 12.87 | 12.87 | 12.87 | 12.87 |
| EBITDA | 85.8 | 78.2 | 83.6 | 77.4 | 67.8 | 105.8 | 119.5 | 134.8 | 152.2 | 171.8 |
| EBITDA, % | 43.06 | 29.22 | 29.03 | 25.49 | 21.44 | 29.65 | 29.65 | 29.65 | 29.65 | 29.65 |
| Depreciation | 40.2 | 50.5 | 54.0 | 57.8 | 58.3 | 68.0 | 76.7 | 86.6 | 97.8 | 110.3 |
| Depreciation, % | 20.17 | 18.85 | 18.74 | 19.05 | 18.42 | 19.04 | 19.04 | 19.04 | 19.04 | 19.04 |
| EBIT | 45.6 | 27.8 | 29.7 | 19.6 | 9.6 | 37.9 | 42.7 | 48.2 | 54.4 | 61.4 |
| EBIT, % | 22.89 | 10.37 | 10.29 | 6.44 | 3.02 | 10.6 | 10.6 | 10.6 | 10.6 | 10.6 |
| Total Cash | 37.7 | 113.6 | 55.8 | 80.4 | 92.8 | 97.5 | 110.1 | 124.2 | 140.2 | 158.3 |
| Total Cash, percent | .0 | .0 | .0 | .0 | .0 | .0 | .0 | .0 | .0 | .0 |
| Account Receivables | 26.5 | 24.9 | 32.9 | 33.4 | 35.0 | 40.0 | 45.2 | 51.0 | 57.6 | 65.0 |
| Account Receivables, % | 13.28 | 9.31 | 11.42 | 10.99 | 11.08 | 11.22 | 11.22 | 11.22 | 11.22 | 11.22 |
| Inventories | 7.5 | .0 | 30.0 | .0 | .0 | 10.1 | 11.4 | 12.9 | 14.6 | 16.4 |
| Inventories, % | 3.78 | 0 | 10.42 | 0 | 0 | 2.84 | 2.84 | 2.84 | 2.84 | 2.84 |
| Accounts Payable | 2.3 | 2.3 | 1.2 | 4.4 | 6.8 | 4.3 | 4.9 | 5.5 | 6.2 | 7.0 |
| Accounts Payable, % | 1.13 | 0.87232 | 0.43361 | 1.45 | 2.15 | 1.21 | 1.21 | 1.21 | 1.21 | 1.21 |
| Capital Expenditure | -7.3 | -5.7 | -9.4 | -10.2 | -.4 | -9.0 | -10.1 | -11.4 | -12.9 | -14.5 |
| Capital Expenditure, % | -3.68 | -2.15 | -3.25 | -3.36 | -0.11603 | -2.51 | -2.51 | -2.51 | -2.51 | -2.51 |
| Tax Rate, % | -3.15 | -3.15 | -3.15 | -3.15 | -3.15 | -3.15 | -3.15 | -3.15 | -3.15 | -3.15 |
| EBITAT | 38.2 | 57.2 | 7.1 | 44.7 | 9.9 | 30.9 | 34.8 | 39.3 | 44.4 | 50.1 |
| Depreciation | ||||||||||
| Changes in Account Receivables | ||||||||||
| Changes in Inventories | ||||||||||
| Changes in Accounts Payable | ||||||||||
| Capital Expenditure | ||||||||||
| UFCF | 39.3 | 111.0 | 12.6 | 125.1 | 68.5 | 72.2 | 95.5 | 107.8 | 121.7 | 137.4 |
| WACC, % | 7.78 | 8.09 | 6.63 | 8.09 | 8.09 | 7.74 | 7.74 | 7.74 | 7.74 | 7.74 |
| PV UFCF | ||||||||||
| SUM PV UFCF | 420.6 | |||||||||
| Long Term Growth Rate, % | 2.00 | |||||||||
| Free cash flow (T + 1) | 140 | |||||||||
| Terminal Value | 2,443 | |||||||||
| Present Terminal Value | 1,683 | |||||||||
| Enterprise Value | 2,104 | |||||||||
| Net Debt | 377 | |||||||||
| Equity Value | 1,727 | |||||||||
| Diluted Shares Outstanding, MM | 76 | |||||||||
| Equity Value Per Share | 22.65 |
What You Will Get
- Pre-Filled Financial Model: MeridianLink’s actual data enables precise DCF valuation.
- Full Forecast Control: Adjust revenue growth, margins, WACC, and other key drivers.
- Instant Calculations: Automatic updates ensure you see results as you make changes.
- Investor-Ready Template: A refined Excel file designed for professional-grade valuation.
- Customizable and Reusable: Tailored for flexibility, allowing repeated use for detailed forecasts.
Key Features
- Comprehensive Historical Data: MeridianLink's (MLNK) past financial statements and forecast templates.
- Customizable Parameters: Adjust WACC, tax rates, revenue growth, and EBITDA margins to fit your analysis.
- Real-Time Valuation: View MeridianLink's intrinsic value update instantly as you make changes.
- Intuitive Visualizations: Engaging dashboard graphs showcase valuation outcomes and essential metrics.
- Designed for Precision: A reliable tool tailored for analysts, investors, and finance professionals.
How It Works
- Step 1: Download the Excel file.
- Step 2: Review pre-entered MeridianLink, Inc. (MLNK) data (historical and projected).
- Step 3: Adjust key assumptions (yellow cells) based on your analysis.
- Step 4: View automatic recalculations for MeridianLink, Inc. (MLNK)’s intrinsic value.
- Step 5: Use the outputs for investment decisions or reporting.
Why Choose This Calculator?
- User-Friendly Interface: Crafted for both newcomers and seasoned professionals.
- Customizable Inputs: Effortlessly adjust parameters to suit your financial analysis.
- Real-Time Adjustments: Observe immediate updates to MeridianLink, Inc.'s (MLNK) valuation as you modify inputs.
- Preloaded Data: Comes equipped with MeridianLink, Inc.'s (MLNK) actual financial figures for rapid assessments.
- Relied Upon by Experts: Favored by investors and analysts for making well-informed choices.
Who Should Use MeridianLink, Inc. (MLNK)?
- Banking Professionals: Enhance your operations with advanced lending and account opening solutions.
- Financial Institutions: Streamline processes and improve customer experiences with our integrated platform.
- Consultants: Customize our tools to deliver tailored solutions for your clients in the financial sector.
- Tech Enthusiasts: Explore innovative technology that drives efficiency in financial services.
- Educators and Students: Utilize our resources to gain insights into the latest trends in fintech and digital banking.
What the Template Contains
- Historical Data: Includes MeridianLink’s past financials and baseline forecasts.
- DCF and Levered DCF Models: Detailed templates to calculate MeridianLink’s intrinsic value.
- WACC Sheet: Pre-built calculations for Weighted Average Cost of Capital.
- Editable Inputs: Modify key drivers like growth rates, EBITDA %, and CAPEX assumptions.
- Quarterly and Annual Statements: A complete breakdown of MeridianLink’s financials.
- Interactive Dashboard: Visualize valuation results and projections dynamically.
Disclaimer
All information, articles, and product details provided on this website are for general informational and educational purposes only. We do not claim any ownership over, nor do we intend to infringe upon, any trademarks, copyrights, logos, brand names, or other intellectual property mentioned or depicted on this site. Such intellectual property remains the property of its respective owners, and any references here are made solely for identification or informational purposes, without implying any affiliation, endorsement, or partnership.
We make no representations or warranties, express or implied, regarding the accuracy, completeness, or suitability of any content or products presented. Nothing on this website should be construed as legal, tax, investment, financial, medical, or other professional advice. In addition, no part of this site—including articles or product references—constitutes a solicitation, recommendation, endorsement, advertisement, or offer to buy or sell any securities, franchises, or other financial instruments, particularly in jurisdictions where such activity would be unlawful.
All content is of a general nature and may not address the specific circumstances of any individual or entity. It is not a substitute for professional advice or services. Any actions you take based on the information provided here are strictly at your own risk. You accept full responsibility for any decisions or outcomes arising from your use of this website and agree to release us from any liability in connection with your use of, or reliance upon, the content or products found herein.