
|
Lagardere SA (MMB.PA) Avaliação DCF |
Totalmente Editável: Adapte-Se Às Suas Necessidades No Excel Ou Planilhas
Design Profissional: Modelos Confiáveis E Padrão Da Indústria
Pré-Construídos Para Uso Rápido E Eficiente
Compatível com MAC/PC, totalmente desbloqueado
Não É Necessária Experiência; Fácil De Seguir
Lagardere SA (MMB.PA) Bundle
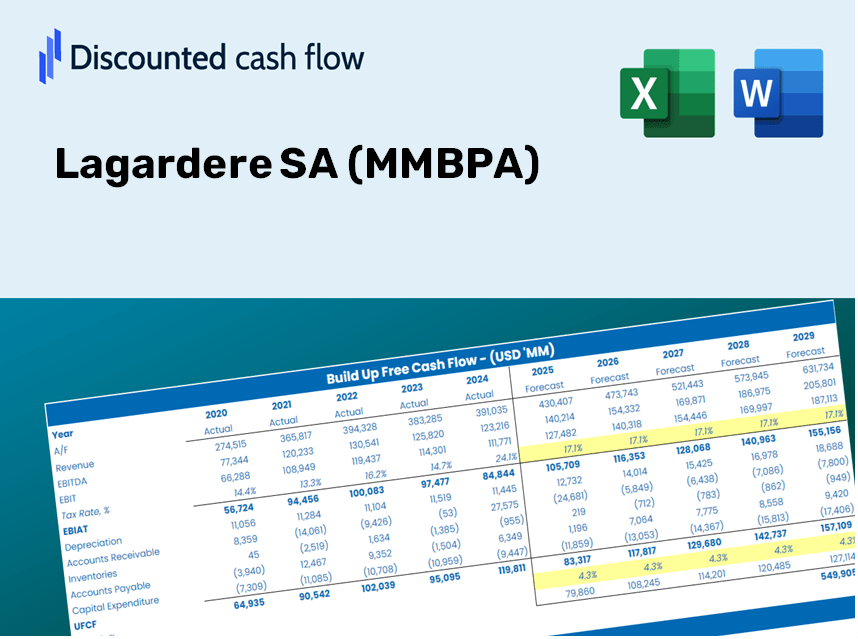
Avalie as perspectivas financeiras de Lagardere SA (MMBPA) como um especialista! Esta calculadora DCF (MMBPA) vem com dados financeiros pré-preenchidos e oferece total flexibilidade para modificar o crescimento da receita, o WACC, as margens e outras suposições vitais para se alinhar às suas projeções.
Discounted Cash Flow (DCF) - (USD MM)
| Year | AY1 2020 |
AY2 2021 |
AY3 2022 |
AY4 2023 |
AY5 2024 |
FY1 2025 |
FY2 2026 |
FY3 2027 |
FY4 2028 |
FY5 2029 |
|---|---|---|---|---|---|---|---|---|---|---|
| Revenue | 4,480.0 | 5,171.0 | 6,977.0 | 8,131.0 | 8,999.0 | 10,744.0 | 12,827.4 | 15,314.8 | 18,284.5 | 21,830.1 |
| Revenue Growth, % | 0 | 15.42 | 34.93 | 16.54 | 10.68 | 19.39 | 19.39 | 19.39 | 19.39 | 19.39 |
| EBITDA | 267.0 | 744.0 | 926.0 | 1,099.0 | 1,358.0 | 1,337.1 | 1,596.4 | 1,906.0 | 2,275.6 | 2,716.8 |
| EBITDA, % | 5.96 | 14.39 | 13.27 | 13.52 | 15.09 | 12.45 | 12.45 | 12.45 | 12.45 | 12.45 |
| Depreciation | 769.0 | 672.0 | 612.0 | 663.0 | 769.0 | 1,195.4 | 1,427.2 | 1,704.0 | 2,034.4 | 2,428.9 |
| Depreciation, % | 17.17 | 13 | 8.77 | 8.15 | 8.55 | 11.13 | 11.13 | 11.13 | 11.13 | 11.13 |
| EBIT | -502.0 | 72.0 | 314.0 | 436.0 | 589.0 | 141.7 | 169.2 | 202.0 | 241.2 | 287.9 |
| EBIT, % | -11.21 | 1.39 | 4.5 | 5.36 | 6.55 | 1.32 | 1.32 | 1.32 | 1.32 | 1.32 |
| Total Cash | 687.0 | 937.0 | 851.0 | 467.0 | 393.0 | 1,198.2 | 1,430.6 | 1,708.0 | 2,039.2 | 2,434.6 |
| Total Cash, percent | .0 | .0 | .0 | .0 | .0 | .0 | .0 | .0 | .0 | .0 |
| Account Receivables | 1,432.0 | 1,471.0 | 1,042.0 | 1,385.0 | 1,399.0 | 2,319.1 | 2,768.8 | 3,305.7 | 3,946.8 | 4,712.1 |
| Account Receivables, % | 31.96 | 28.45 | 14.93 | 17.03 | 15.55 | 21.59 | 21.59 | 21.59 | 21.59 | 21.59 |
| Inventories | 498.0 | 632.0 | 833.0 | 842.0 | 849.0 | 1,183.3 | 1,412.7 | 1,686.7 | 2,013.8 | 2,404.2 |
| Inventories, % | 11.12 | 12.22 | 11.94 | 10.36 | 9.43 | 11.01 | 11.01 | 11.01 | 11.01 | 11.01 |
| Accounts Payable | 1,042.0 | 1,298.0 | 1,379.0 | 1,392.0 | 1,453.0 | 2,178.7 | 2,601.2 | 3,105.6 | 3,707.8 | 4,426.8 |
| Accounts Payable, % | 23.26 | 25.1 | 19.76 | 17.12 | 16.15 | 20.28 | 20.28 | 20.28 | 20.28 | 20.28 |
| Capital Expenditure | -179.0 | -156.0 | -222.0 | -269.0 | -293.0 | -360.1 | -429.9 | -513.3 | -612.8 | -731.7 |
| Capital Expenditure, % | -4 | -3.02 | -3.18 | -3.31 | -3.26 | -3.35 | -3.35 | -3.35 | -3.35 | -3.35 |
| Tax Rate, % | 48.94 | 48.94 | 48.94 | 48.94 | 48.94 | 48.94 | 48.94 | 48.94 | 48.94 | 48.94 |
| EBITAT | -474.0 | 110.2 | 273.3 | 253.2 | 300.8 | 110.7 | 132.2 | 157.8 | 188.4 | 224.9 |
| Depreciation | ||||||||||
| Changes in Account Receivables | ||||||||||
| Changes in Inventories | ||||||||||
| Changes in Accounts Payable | ||||||||||
| Capital Expenditure | ||||||||||
| UFCF | -772.0 | 709.2 | 972.3 | 308.2 | 816.8 | 417.3 | 872.8 | 1,042.0 | 1,244.1 | 1,485.3 |
| WACC, % | 5.92 | 6.11 | 5.66 | 4.66 | 4.42 | 5.35 | 5.35 | 5.35 | 5.35 | 5.35 |
| PV UFCF | ||||||||||
| SUM PV UFCF | 4,227.6 | |||||||||
| Long Term Growth Rate, % | 3.50 | |||||||||
| Free cash flow (T + 1) | 1,537 | |||||||||
| Terminal Value | 82,902 | |||||||||
| Present Terminal Value | 63,870 | |||||||||
| Enterprise Value | 68,098 | |||||||||
| Net Debt | 4,503 | |||||||||
| Equity Value | 63,595 | |||||||||
| Diluted Shares Outstanding, MM | 142 | |||||||||
| Equity Value Per Share | 446.68 |
What You Will Receive
- Pre-Filled Financial Model: Utilize Lagardere SA's actual data for accurate DCF valuation.
- Comprehensive Forecast Control: Modify revenue growth, profit margins, WACC, and other essential drivers.
- Real-Time Calculations: Instant updates allow you to view results immediately as changes are made.
- Professional-Grade Template: A polished Excel file specifically created for high-quality valuation.
- Flexible and Reusable: Designed for adaptability, enabling recurrent use for in-depth forecasts.
Key Features
- Real-Time MMBPA Data: Pre-loaded with Lagardere SA’s historical metrics and future projections.
- Customizable Variables: Modify revenue growth rates, profit margins, WACC, tax rates, and capital expenditure estimates.
- Interactive Valuation Framework: Automatically recalculates Net Present Value (NPV) and intrinsic value based on user inputs.
- Scenario Analysis: Develop various forecasting scenarios to evaluate different valuation results.
- User-Centric Interface: Intuitive design tailored for both experienced professionals and newcomers.
How It Operates
- Step 1: Download the Excel spreadsheet.
- Step 2: Examine the pre-filled Lagardere SA (MMBPA) data (historical and forecasted).
- Step 3: Modify key assumptions (highlighted in yellow) based on your insights.
- Step 4: Observe automatic updates for Lagardere SA’s intrinsic value.
- Step 5: Utilize the results for investment strategies or reporting purposes.
Why Use the Lagardere SA (MMBPA) Calculator?
- Save Time: Skip the complexities of building a DCF model—our tool is ready for immediate use.
- Enhance Precision: Dependable financial data and formulas minimize errors in your valuations.
- Completely Customizable: Adjust the model to align with your specific assumptions and forecasts.
- Intuitive Presentation: User-friendly charts and outputs simplify the analysis of results.
- Endorsed by Professionals: Crafted for experts who prioritize accuracy and ease of use.
Who Can Benefit from This Product?
- Investors: Evaluate Lagardere SA’s (MMBPA) valuation prior to making investment decisions.
- CFOs and Financial Analysts: Enhance valuation workflows and assess financial forecasts.
- Startup Founders: Gain insights into the valuation methods used for large public companies like Lagardere SA.
- Consultants: Provide detailed valuation reports tailored to client needs.
- Students and Educators: Utilize actual market data to explore and teach valuation methodologies.
Contents of the Template
- Pre-Filled Data: Features Lagardere SA's (MMBPA) historical financial information and projections.
- Discounted Cash Flow Model: An editable DCF valuation model with automatic calculation capabilities.
- Weighted Average Cost of Capital (WACC): A dedicated worksheet for calculating WACC using customized inputs.
- Key Financial Ratios: Assess Lagardere SA’s (MMBPA) profitability, efficiency, and financial leverage.
- Customizable Inputs: Easily modify revenue growth rates, profit margins, and tax rates.
- Clear Dashboard: Visual representations and tables summarizing essential valuation outcomes.
Disclaimer
All information, articles, and product details provided on this website are for general informational and educational purposes only. We do not claim any ownership over, nor do we intend to infringe upon, any trademarks, copyrights, logos, brand names, or other intellectual property mentioned or depicted on this site. Such intellectual property remains the property of its respective owners, and any references here are made solely for identification or informational purposes, without implying any affiliation, endorsement, or partnership.
We make no representations or warranties, express or implied, regarding the accuracy, completeness, or suitability of any content or products presented. Nothing on this website should be construed as legal, tax, investment, financial, medical, or other professional advice. In addition, no part of this site—including articles or product references—constitutes a solicitation, recommendation, endorsement, advertisement, or offer to buy or sell any securities, franchises, or other financial instruments, particularly in jurisdictions where such activity would be unlawful.
All content is of a general nature and may not address the specific circumstances of any individual or entity. It is not a substitute for professional advice or services. Any actions you take based on the information provided here are strictly at your own risk. You accept full responsibility for any decisions or outcomes arising from your use of this website and agree to release us from any liability in connection with your use of, or reliance upon, the content or products found herein.