
|
MONDI PLC (MNDI.L) Avaliação DCF |
Totalmente Editável: Adapte-Se Às Suas Necessidades No Excel Ou Planilhas
Design Profissional: Modelos Confiáveis E Padrão Da Indústria
Pré-Construídos Para Uso Rápido E Eficiente
Compatível com MAC/PC, totalmente desbloqueado
Não É Necessária Experiência; Fácil De Seguir
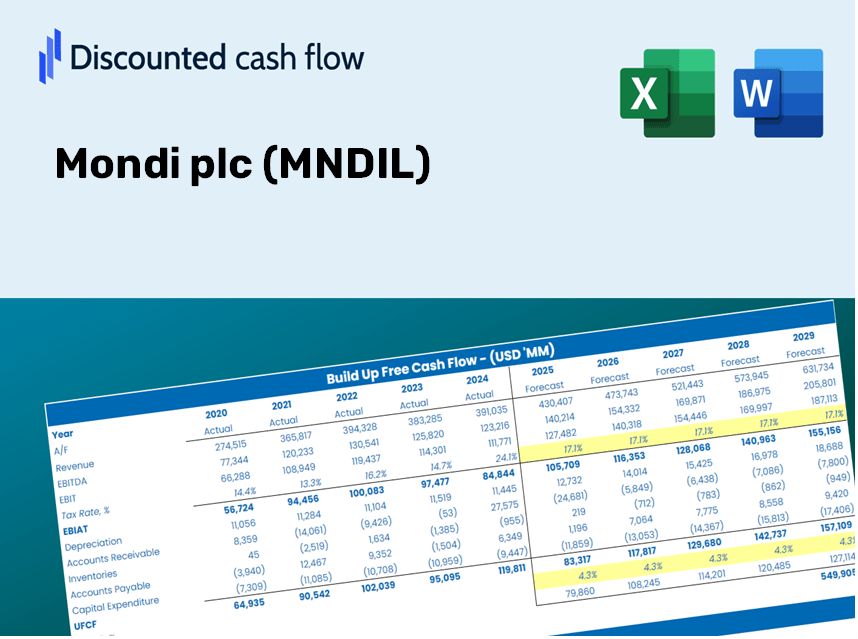
Mondi plc (MNDI.L) Bundle
Aprimore suas opções de investimento com a calculadora DCF Mondi Plc (Mndil)! Utilize dados financeiros genuínos da Mondi, ajuste as projeções e despesas de crescimento e observe instantaneamente como essas alterações afetam o valor intrínseco do Mondi PLC (MNDIL).
Discounted Cash Flow (DCF) - (USD MM)
| Year | AY1 2020 |
AY2 2021 |
AY3 2022 |
AY4 2023 |
AY5 2024 |
FY1 2025 |
FY2 2026 |
FY3 2027 |
FY4 2028 |
FY5 2029 |
|---|---|---|---|---|---|---|---|---|---|---|
| Revenue | 5,849.4 | 6,122.4 | 7,814.9 | 6,434.9 | 6,510.4 | 6,768.0 | 7,035.8 | 7,314.2 | 7,603.6 | 7,904.5 |
| Revenue Growth, % | 0 | 4.67 | 27.65 | -17.66 | 1.17 | 3.96 | 3.96 | 3.96 | 3.96 | 3.96 |
| EBITDA | 1,137.7 | 1,029.8 | 1,452.9 | 1,064.0 | 805.9 | 1,134.0 | 1,178.9 | 1,225.5 | 1,274.0 | 1,324.4 |
| EBITDA, % | 19.45 | 16.82 | 18.59 | 16.53 | 12.38 | 16.76 | 16.76 | 16.76 | 16.76 | 16.76 |
| Depreciation | 375.7 | 329.2 | 345.9 | 358.2 | 388.9 | 375.8 | 390.7 | 406.2 | 422.2 | 439.0 |
| Depreciation, % | 6.42 | 5.38 | 4.43 | 5.57 | 5.97 | 5.55 | 5.55 | 5.55 | 5.55 | 5.55 |
| EBIT | 762.0 | 700.6 | 1,107.0 | 705.8 | 417.0 | 758.1 | 788.1 | 819.3 | 851.7 | 885.4 |
| EBIT, % | 13.03 | 11.44 | 14.17 | 10.97 | 6.41 | 11.2 | 11.2 | 11.2 | 11.2 | 11.2 |
| Total Cash | 336.2 | 415.2 | 937.6 | 1,409.9 | 244.1 | 679.3 | 706.2 | 734.1 | 763.2 | 793.4 |
| Total Cash, percent | .0 | .0 | .0 | .0 | .0 | .0 | .0 | .0 | .0 | .0 |
| Account Receivables | 744.4 | 1,004.3 | 1,074.5 | 851.5 | 1,119.3 | 992.3 | 1,031.5 | 1,072.4 | 1,114.8 | 1,158.9 |
| Account Receivables, % | 12.73 | 16.4 | 13.75 | 13.23 | 17.19 | 14.66 | 14.66 | 14.66 | 14.66 | 14.66 |
| Inventories | 745.3 | 964.8 | 1,193.0 | 920.9 | 1,048.2 | 1,004.1 | 1,043.8 | 1,085.1 | 1,128.0 | 1,172.7 |
| Inventories, % | 12.74 | 15.76 | 15.27 | 14.31 | 16.1 | 14.84 | 14.84 | 14.84 | 14.84 | 14.84 |
| Accounts Payable | 482.0 | 722.5 | 771.7 | 555.7 | 1,124.6 | 755.6 | 785.5 | 816.6 | 848.9 | 882.5 |
| Accounts Payable, % | 8.24 | 11.8 | 9.87 | 8.64 | 17.27 | 11.16 | 11.16 | 11.16 | 11.16 | 11.16 |
| Capital Expenditure | -590.8 | -461.8 | -489.0 | -784.8 | -872.6 | -670.0 | -696.5 | -724.1 | -752.8 | -782.5 |
| Capital Expenditure, % | -10.1 | -7.54 | -6.26 | -12.2 | -13.4 | -9.9 | -9.9 | -9.9 | -9.9 | -9.9 |
| Tax Rate, % | 42.33 | 42.33 | 42.33 | 42.33 | 42.33 | 42.33 | 42.33 | 42.33 | 42.33 | 42.33 |
| EBITAT | 576.0 | 534.3 | 1,030.4 | -158.3 | 240.5 | 458.8 | 477.0 | 495.8 | 515.5 | 535.9 |
| Depreciation | ||||||||||
| Changes in Account Receivables | ||||||||||
| Changes in Inventories | ||||||||||
| Changes in Accounts Payable | ||||||||||
| Capital Expenditure | ||||||||||
| UFCF | -646.9 | 162.9 | 638.0 | -305.8 | -69.4 | -33.2 | 122.1 | 126.9 | 131.9 | 137.1 |
| WACC, % | 6 | 6.01 | 6.27 | 4.84 | 5.72 | 5.77 | 5.77 | 5.77 | 5.77 | 5.77 |
| PV UFCF | ||||||||||
| SUM PV UFCF | 394.0 | |||||||||
| Long Term Growth Rate, % | 0.50 | |||||||||
| Free cash flow (T + 1) | 138 | |||||||||
| Terminal Value | 2,616 | |||||||||
| Present Terminal Value | 1,976 | |||||||||
| Enterprise Value | 2,370 | |||||||||
| Net Debt | 1,525 | |||||||||
| Equity Value | 845 | |||||||||
| Diluted Shares Outstanding, MM | 447 | |||||||||
| Equity Value Per Share | 188.97 |
Your Benefits
- Comprehensive MNDIL Financial Data: Access historical and projected figures for precise valuation.
- Customizable Variables: Adjust WACC, tax rates, revenue growth, and capital expenditures to suit your analysis.
- Automated Calculations: Intrinsic value and NPV are computed in real-time.
- Scenario Testing: Experiment with various scenarios to assess Mondi's future performance.
- User-Friendly Interface: Designed for industry experts while remaining approachable for newcomers.
Key Features
- Comprehensive DCF Calculator: Offers both unlevered and levered DCF valuation frameworks.
- WACC Calculator: Features a pre-designed Weighted Average Cost of Capital model with adjustable parameters.
- Customizable Forecast Assumptions: Adjust growth projections, capital investments, and discount rates as needed.
- Integrated Financial Ratios: Evaluate profitability, leverage, and efficiency metrics specifically for Mondi plc (MNDIL).
- User-Friendly Dashboard and Charts: Visual summaries showcase essential valuation indicators for straightforward analysis.
How It Works
- Step 1: Download the prebuilt Excel template that includes data for Mondi plc (MNDIL).
- Step 2: Review the pre-filled sheets and familiarize yourself with the essential metrics.
- Step 3: Modify projections and assumptions in the editable yellow cells (WACC, growth, margins).
- Step 4: Instantly see the updated results, including the intrinsic value of Mondi plc (MNDIL).
- Step 5: Use the outputs to make informed investment choices or create comprehensive reports.
Why Choose This Calculator for Mondi plc (MNDIL)?
- Designed for Experts: A sophisticated tool favored by analysts, CFOs, and consultants.
- Accurate Financial Data: Historical and projected financials for Mondi plc preloaded for precise analysis.
- Scenario Analysis: Effortlessly test various forecasts and assumptions.
- Clear Results: Instantly computes intrinsic value, NPV, and essential metrics.
- User-Friendly: Step-by-step guidelines simplify the entire process.
Who Can Benefit from Mondi plc (MNDIL)?
- Investors: Gain the insights needed to make informed investment choices with our advanced analytics tools.
- Financial Analysts: Streamline your workflow using our ready-to-customize DCF model.
- Consultants: Effortlessly tailor presentations or reports for your clients using our adaptable templates.
- Finance Enthusiasts: Enhance your knowledge of valuation methods through practical, real-world scenarios.
- Educators and Students: Leverage our resources as effective learning aids in finance-related disciplines.
Contents of the Template
- Detailed DCF Model: Fully editable template featuring comprehensive valuation calculations.
- Market Data: Historical and projected financial information for Mondi plc (MNDIL) preloaded for in-depth analysis.
- Adjustable Parameters: Modify WACC, growth rates, and tax assumptions to explore different scenarios.
- Financial Statements: Complete annual and quarterly reports for enhanced financial insights.
- Essential Ratios: Integrated analysis for profitability, efficiency, and financial leverage.
- Visual Dashboard: Interactive charts and tables for clear, actionable insights.
Disclaimer
All information, articles, and product details provided on this website are for general informational and educational purposes only. We do not claim any ownership over, nor do we intend to infringe upon, any trademarks, copyrights, logos, brand names, or other intellectual property mentioned or depicted on this site. Such intellectual property remains the property of its respective owners, and any references here are made solely for identification or informational purposes, without implying any affiliation, endorsement, or partnership.
We make no representations or warranties, express or implied, regarding the accuracy, completeness, or suitability of any content or products presented. Nothing on this website should be construed as legal, tax, investment, financial, medical, or other professional advice. In addition, no part of this site—including articles or product references—constitutes a solicitation, recommendation, endorsement, advertisement, or offer to buy or sell any securities, franchises, or other financial instruments, particularly in jurisdictions where such activity would be unlawful.
All content is of a general nature and may not address the specific circumstances of any individual or entity. It is not a substitute for professional advice or services. Any actions you take based on the information provided here are strictly at your own risk. You accept full responsibility for any decisions or outcomes arising from your use of this website and agree to release us from any liability in connection with your use of, or reliance upon, the content or products found herein.