
|
Mente C.T.I. Ltd (MNDO) DCF Avaliação |
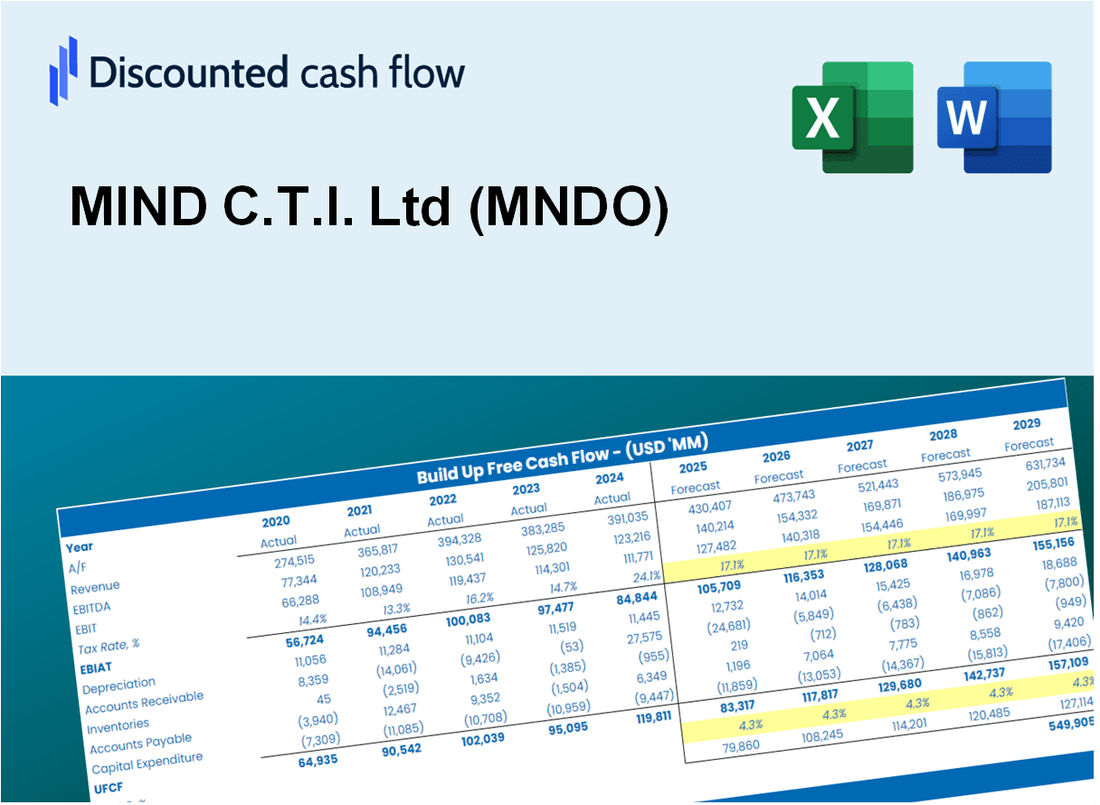
Totalmente Editável: Adapte-Se Às Suas Necessidades No Excel Ou Planilhas
Design Profissional: Modelos Confiáveis E Padrão Da Indústria
Pré-Construídos Para Uso Rápido E Eficiente
Compatível com MAC/PC, totalmente desbloqueado
Não É Necessária Experiência; Fácil De Seguir
MIND C.T.I. Ltd (MNDO) Bundle
Descubra o verdadeiro potencial da mente C.T.I. Ltd (MNDO) com nossa calculadora DCF avançada! Ajuste as principais suposições, explore vários cenários e avalie como as mudanças afetam a mente C.T.I. Avaliação Ltd (MNDO) - Tudo dentro de um modelo abrangente do Excel.
Discounted Cash Flow (DCF) - (USD MM)
| Year | AY1 2020 |
AY2 2021 |
AY3 2022 |
AY4 2023 |
AY5 2024 |
FY1 2025 |
FY2 2026 |
FY3 2027 |
FY4 2028 |
FY5 2029 |
|---|---|---|---|---|---|---|---|---|---|---|
| Revenue | 23.4 | 26.3 | 21.6 | 21.6 | 21.4 | 21.1 | 20.8 | 20.5 | 20.2 | 19.9 |
| Revenue Growth, % | 0 | 12.65 | -18.15 | 0.28305 | -0.76809 | -1.5 | -1.5 | -1.5 | -1.5 | -1.5 |
| EBITDA | 6.1 | 7.1 | 5.9 | 5.7 | 5.2 | 5.5 | 5.5 | 5.4 | 5.3 | 5.2 |
| EBITDA, % | 25.95 | 27.06 | 27.34 | 26.6 | 24.13 | 26.22 | 26.22 | 26.22 | 26.22 | 26.22 |
| Depreciation | .2 | .2 | .2 | .2 | .2 | .2 | .2 | .2 | .2 | .2 |
| Depreciation, % | 0.85565 | 0.73677 | 0.89555 | 0.9069 | 0.86729 | 0.85243 | 0.85243 | 0.85243 | 0.85243 | 0.85243 |
| EBIT | 5.9 | 6.9 | 5.7 | 5.6 | 5.0 | 5.4 | 5.3 | 5.2 | 5.1 | 5.0 |
| EBIT, % | 25.09 | 26.33 | 26.45 | 25.69 | 23.26 | 25.36 | 25.36 | 25.36 | 25.36 | 25.36 |
| Total Cash | 17.0 | 18.5 | 17.5 | 16.6 | 15.8 | 15.8 | 15.6 | 15.3 | 15.1 | 14.9 |
| Total Cash, percent | .0 | .0 | .0 | .0 | .0 | .0 | .0 | .0 | .0 | .0 |
| Account Receivables | 2.4 | 1.9 | 2.5 | 2.6 | 2.8 | 2.3 | 2.3 | 2.2 | 2.2 | 2.2 |
| Account Receivables, % | 10.28 | 7.4 | 11.8 | 12.21 | 12.85 | 10.91 | 10.91 | 10.91 | 10.91 | 10.91 |
| Inventories | .0 | .0 | .0 | .0 | .0 | .0 | .0 | .0 | .0 | .0 |
| Inventories, % | 0 | 0 | 0 | 0 | 0 | 0 | 0 | 0 | 0 | 0 |
| Accounts Payable | 1.3 | .8 | .9 | 1.0 | .8 | .9 | .9 | .9 | .9 | .8 |
| Accounts Payable, % | 5.47 | 3.19 | 4.35 | 4.58 | 3.59 | 4.23 | 4.23 | 4.23 | 4.23 | 4.23 |
| Capital Expenditure | -.1 | -.1 | -.1 | -.1 | .0 | -.1 | -.1 | -.1 | -.1 | -.1 |
| Capital Expenditure, % | -0.29092 | -0.31142 | -0.60322 | -0.29613 | -0.04662874 | -0.30966 | -0.30966 | -0.30966 | -0.30966 | -0.30966 |
| Tax Rate, % | 6.73 | 6.73 | 6.73 | 6.73 | 6.73 | 6.73 | 6.73 | 6.73 | 6.73 | 6.73 |
| EBITAT | 5.4 | 6.0 | 5.4 | 5.2 | 4.7 | 4.9 | 4.8 | 4.8 | 4.7 | 4.6 |
| Depreciation | ||||||||||
| Changes in Account Receivables | ||||||||||
| Changes in Inventories | ||||||||||
| Changes in Accounts Payable | ||||||||||
| Capital Expenditure | ||||||||||
| UFCF | 4.4 | 6.1 | 4.9 | 5.3 | 4.5 | 5.6 | 5.0 | 4.9 | 4.8 | 4.8 |
| WACC, % | 6.44 | 6.44 | 6.45 | 6.45 | 6.45 | 6.44 | 6.44 | 6.44 | 6.44 | 6.44 |
| PV UFCF | ||||||||||
| SUM PV UFCF | 21.0 | |||||||||
| Long Term Growth Rate, % | 0.50 | |||||||||
| Free cash flow (T + 1) | 5 | |||||||||
| Terminal Value | 81 | |||||||||
| Present Terminal Value | 59 | |||||||||
| Enterprise Value | 80 | |||||||||
| Net Debt | -4 | |||||||||
| Equity Value | 84 | |||||||||
| Diluted Shares Outstanding, MM | 21 | |||||||||
| Equity Value Per Share | 4.06 |
What You Will Receive
- Customizable Excel Template: A fully editable Excel-based DCF Calculator featuring pre-filled financial data for MIND C.T.I. Ltd (MNDO).
- Accurate Data: Historical performance metrics and future projections (highlighted in the yellow cells).
- Flexible Forecasting: Adjust key assumptions such as revenue growth, EBITDA %, and WACC as needed.
- Instant Calculations: Quickly observe how your inputs affect the valuation of MIND C.T.I. Ltd (MNDO).
- Professional Resource: Designed for investors, CFOs, consultants, and financial analysts.
- Intuitive Layout: Organized for simplicity and ease of navigation, complete with step-by-step guidance.
Key Features
- 🔍 Real-Life MNDO Financials: Pre-filled historical and projected data for MIND C.T.I. Ltd.
- ✏️ Fully Customizable Inputs: Adjust all critical parameters (yellow cells) like WACC, growth %, and tax rates.
- 📊 Professional DCF Valuation: Built-in formulas calculate MIND C.T.I. Ltd's intrinsic value using the Discounted Cash Flow method.
- ⚡ Instant Results: Visualize MIND C.T.I. Ltd's valuation instantly after making changes.
- Scenario Analysis: Test and compare outcomes for various financial assumptions side-by-side.
How It Works
- Step 1: Download the Excel file.
- Step 2: Review pre-entered MIND C.T.I. Ltd (MNDO) data (historical and projected).
- Step 3: Adjust key assumptions (yellow cells) based on your analysis.
- Step 4: View automatic recalculations for MIND C.T.I. Ltd (MNDO)’s intrinsic value.
- Step 5: Use the outputs for investment decisions or reporting.
Why Choose MIND C.T.I. Ltd (MNDO) Calculator?
- User-Friendly Interface: Tailored for both novice users and seasoned professionals.
- Customizable Inputs: Adjust parameters easily to suit your analytical needs.
- Real-Time Insights: Watch MIND C.T.I. Ltd's valuation update instantly as you tweak inputs.
- Pre-Configured Data: Comes with MIND C.T.I. Ltd's latest financial metrics for swift evaluations.
- Preferred by Experts: Utilized by investors and analysts for making well-informed choices.
Who Should Use This Product?
- Individual Investors: Make informed decisions about buying or selling MIND C.T.I. Ltd (MNDO) stock.
- Financial Analysts: Streamline valuation processes with ready-to-use financial models for MIND C.T.I. Ltd (MNDO).
- Consultants: Deliver professional valuation insights on MIND C.T.I. Ltd (MNDO) to clients quickly and accurately.
- Business Owners: Understand how companies like MIND C.T.I. Ltd (MNDO) are valued to guide your own strategy.
- Finance Students: Learn valuation techniques using real-world data and scenarios involving MIND C.T.I. Ltd (MNDO).
What the Template Contains
- Preloaded MNDO Data: Historical and projected financial data, including revenue, EBIT, and capital expenditures.
- DCF and WACC Models: Professional-grade sheets for calculating intrinsic value and Weighted Average Cost of Capital.
- Editable Inputs: Yellow-highlighted cells for adjusting revenue growth, tax rates, and discount rates.
- Financial Statements: Comprehensive annual and quarterly financials for deeper analysis.
- Key Ratios: Profitability, leverage, and efficiency ratios to evaluate performance.
- Dashboard and Charts: Visual summaries of valuation outcomes and assumptions.
Disclaimer
All information, articles, and product details provided on this website are for general informational and educational purposes only. We do not claim any ownership over, nor do we intend to infringe upon, any trademarks, copyrights, logos, brand names, or other intellectual property mentioned or depicted on this site. Such intellectual property remains the property of its respective owners, and any references here are made solely for identification or informational purposes, without implying any affiliation, endorsement, or partnership.
We make no representations or warranties, express or implied, regarding the accuracy, completeness, or suitability of any content or products presented. Nothing on this website should be construed as legal, tax, investment, financial, medical, or other professional advice. In addition, no part of this site—including articles or product references—constitutes a solicitation, recommendation, endorsement, advertisement, or offer to buy or sell any securities, franchises, or other financial instruments, particularly in jurisdictions where such activity would be unlawful.
All content is of a general nature and may not address the specific circumstances of any individual or entity. It is not a substitute for professional advice or services. Any actions you take based on the information provided here are strictly at your own risk. You accept full responsibility for any decisions or outcomes arising from your use of this website and agree to release us from any liability in connection with your use of, or reliance upon, the content or products found herein.