
|
M&G PLC (MNG.L) Avaliação DCF |
Totalmente Editável: Adapte-Se Às Suas Necessidades No Excel Ou Planilhas
Design Profissional: Modelos Confiáveis E Padrão Da Indústria
Pré-Construídos Para Uso Rápido E Eficiente
Compatível com MAC/PC, totalmente desbloqueado
Não É Necessária Experiência; Fácil De Seguir
M&G plc (MNG.L) Bundle
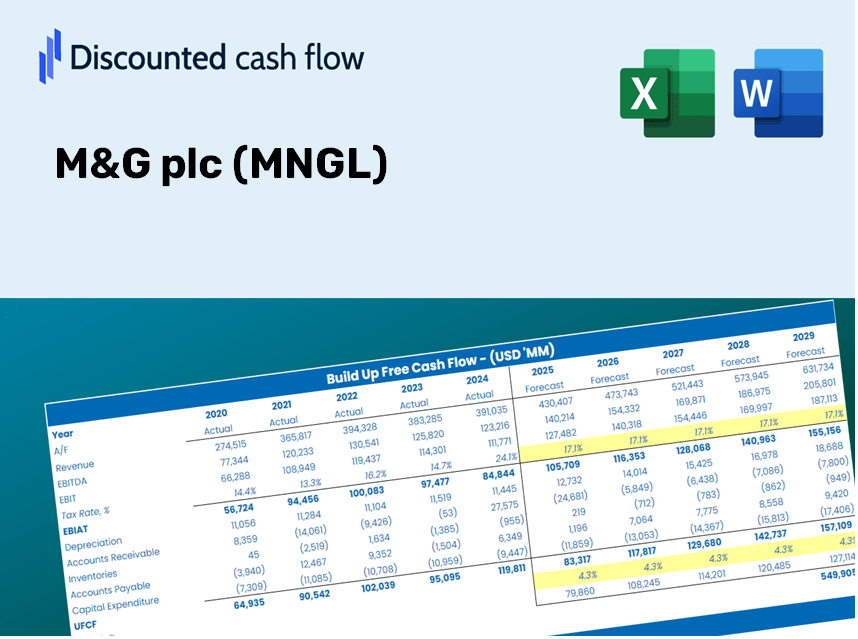
Avalie as perspectivas financeiras da M&G PLC como um especialista! Essa calculadora DCF (MNGL) vem com dados financeiros pré-preenchidos e oferece total flexibilidade para modificar suposições como crescimento de receita, WACC, margens e outras métricas críticas para se alinhar às suas previsões.
Discounted Cash Flow (DCF) - (USD MM)
| Year | AY1 2020 |
AY2 2021 |
AY3 2022 |
AY4 2023 |
AY5 2024 |
FY1 2025 |
FY2 2026 |
FY3 2027 |
FY4 2028 |
FY5 2029 |
|---|---|---|---|---|---|---|---|---|---|---|
| Revenue | 15,761.0 | 16,247.0 | -7,942.0 | 10,665.0 | 11,256.0 | 5,870.7 | 3,061.9 | 1,597.0 | 832.9 | 434.4 |
| Revenue Growth, % | 0 | 3.08 | -148.88 | -234.29 | 5.54 | -47.84 | -47.84 | -47.84 | -47.84 | -47.84 |
| EBITDA | 2,108.0 | 1,095.0 | -2,583.0 | 1,268.0 | 754.0 | 836.3 | 436.2 | 227.5 | 118.7 | 61.9 |
| EBITDA, % | 13.37 | 6.74 | 32.52 | 11.89 | 6.7 | 14.25 | 14.25 | 14.25 | 14.25 | 14.25 |
| Depreciation | 128.0 | 148.0 | 176.0 | 176.0 | 190.0 | 33.4 | 17.4 | 9.1 | 4.7 | 2.5 |
| Depreciation, % | 0.81213 | 0.91094 | -2.22 | 1.65 | 1.69 | 0.56905 | 0.56905 | 0.56905 | 0.56905 | 0.56905 |
| EBIT | 1,980.0 | 947.0 | -2,759.0 | 1,092.0 | 564.0 | 802.9 | 418.8 | 218.4 | 113.9 | 59.4 |
| EBIT, % | 12.56 | 5.83 | 34.74 | 10.24 | 5.01 | 13.68 | 13.68 | 13.68 | 13.68 | 13.68 |
| Total Cash | 6,776.0 | 6,908.0 | 4,884.0 | 5,590.0 | 4,838.0 | 1,402.1 | 731.3 | 381.4 | 198.9 | 103.8 |
| Total Cash, percent | .0 | .0 | .0 | .0 | .0 | .0 | .0 | .0 | .0 | .0 |
| Account Receivables | .0 | .0 | .0 | 2,536.0 | 2,506.0 | 540.6 | 282.0 | 147.1 | 76.7 | 40.0 |
| Account Receivables, % | 0 | 0 | 0 | 23.78 | 22.26 | 9.21 | 9.21 | 9.21 | 9.21 | 9.21 |
| Inventories | .0 | .0 | .0 | .0 | .0 | .0 | .0 | .0 | .0 | .0 |
| Inventories, % | 0 | 0 | 0 | 0 | 0 | 0 | 0 | 0 | 0 | 0 |
| Accounts Payable | 2,414.0 | 52.0 | 4,656.0 | 40.0 | 2,470.0 | -242.7 | -126.6 | -66.0 | -34.4 | -18.0 |
| Accounts Payable, % | 15.32 | 0.32006 | -58.63 | 0.37506 | 21.94 | -4.13 | -4.13 | -4.13 | -4.13 | -4.13 |
| Capital Expenditure | -821.0 | -770.0 | -573.0 | -496.0 | -289.0 | -201.6 | -105.1 | -54.8 | -28.6 | -14.9 |
| Capital Expenditure, % | -5.21 | -4.74 | 7.21 | -4.65 | -2.57 | -3.43 | -3.43 | -3.43 | -3.43 | -3.43 |
| Tax Rate, % | 348.28 | 348.28 | 348.28 | 348.28 | 348.28 | 348.28 | 348.28 | 348.28 | 348.28 | 348.28 |
| EBITAT | 1,357.4 | 125.6 | -1,776.2 | 433.0 | -1,400.3 | 298.4 | 155.6 | 81.2 | 42.3 | 22.1 |
| Depreciation | ||||||||||
| Changes in Account Receivables | ||||||||||
| Changes in Inventories | ||||||||||
| Changes in Accounts Payable | ||||||||||
| Capital Expenditure | ||||||||||
| UFCF | 3,078.4 | -2,858.4 | 2,430.8 | -7,039.0 | 960.7 | -617.0 | 442.7 | 230.9 | 120.4 | 62.8 |
| WACC, % | 6.05 | 4.31 | 5.92 | 5.14 | 3.89 | 5.06 | 5.06 | 5.06 | 5.06 | 5.06 |
| PV UFCF | ||||||||||
| SUM PV UFCF | 160.8 | |||||||||
| Long Term Growth Rate, % | 2.00 | |||||||||
| Free cash flow (T + 1) | 64 | |||||||||
| Terminal Value | 2,092 | |||||||||
| Present Terminal Value | 1,634 | |||||||||
| Enterprise Value | 1,795 | |||||||||
| Net Debt | 2,073 | |||||||||
| Equity Value | -278 | |||||||||
| Diluted Shares Outstanding, MM | 2,388 | |||||||||
| Equity Value Per Share | -11.64 |
Benefits You Will Receive
- Pre-Populated Financial Model: M&G plc’s real data provides accurate DCF valuation.
- Comprehensive Forecasting Control: Modify revenue growth, profit margins, WACC, and other vital parameters.
- Immediate Calculations: Real-time updates enable you to view results instantly as adjustments are made.
- Professional-Grade Template: A polished Excel file crafted for high-level valuation needs.
- Flexible and Reusable: Designed for adaptability, allowing for multiple uses in detailed forecasting.
Key Features
- Pre-Loaded Data: M&G plc’s historical financial statements and pre-filled forecasts.
- Fully Adjustable Inputs: Modify WACC, tax rates, revenue growth, and EBITDA margins as needed.
- Instant Results: Watch M&G plc’s intrinsic value update in real time.
- Clear Visual Outputs: Dashboard charts showcase valuation results and essential metrics.
- Built for Accuracy: A professional tool tailored for analysts, investors, and finance professionals.
How It Functions
- Download: Get the pre-prepared Excel file containing M&G plc’s (MNGL) financial data.
- Customize: Modify forecasts such as revenue growth, EBITDA %, and WACC to fit your analysis.
- Real-Time Updates: The intrinsic value and NPV calculations refresh automatically as you make changes.
- Scenario Testing: Build various projections and compare different outcomes instantly.
- Informed Decisions: Leverage the valuation insights to steer your investment approach.
Why Choose the M&G plc (MNGL) Calculator?
- Time Efficient: Skip the hassle of building a DCF model from the ground up – it's ready for immediate use.
- Enhanced Precision: Dependable financial data and calculations minimize valuation errors.
- Fully Adjustable: Modify the model to align with your specific assumptions and forecasts.
- Simple to Analyze: Intuitive charts and outputs facilitate straightforward results interpretation.
- Expert Approved: Crafted for professionals who prioritize both accuracy and functionality.
Who Can Benefit from This Product?
- Investors: Accurately assess the fair value of M&G plc (MNGL) before making investment choices.
- CFOs: Utilize a professional-grade DCF model for comprehensive financial reporting and analysis.
- Consultants: Effortlessly customize the template for client valuation reports.
- Entrepreneurs: Gain valuable insights into the financial modeling practices of leading corporations.
- Educators: Employ it as a teaching aid to illustrate valuation techniques.
Contents of the Template
- Pre-Filled Data: Contains M&G plc’s historical financial performance and projections.
- Discounted Cash Flow Model: A customizable DCF valuation model with automatic computations.
- Weighted Average Cost of Capital (WACC): A separate tab designed for WACC calculations using tailored inputs.
- Key Financial Ratios: Evaluate M&G plc's profitability, efficiency, and capital structure.
- Customizable Inputs: Easily modify assumptions on revenue growth, profit margins, and tax rates.
- User-Friendly Dashboard: Visual representations including charts and tables highlighting key valuation outcomes.
Disclaimer
All information, articles, and product details provided on this website are for general informational and educational purposes only. We do not claim any ownership over, nor do we intend to infringe upon, any trademarks, copyrights, logos, brand names, or other intellectual property mentioned or depicted on this site. Such intellectual property remains the property of its respective owners, and any references here are made solely for identification or informational purposes, without implying any affiliation, endorsement, or partnership.
We make no representations or warranties, express or implied, regarding the accuracy, completeness, or suitability of any content or products presented. Nothing on this website should be construed as legal, tax, investment, financial, medical, or other professional advice. In addition, no part of this site—including articles or product references—constitutes a solicitation, recommendation, endorsement, advertisement, or offer to buy or sell any securities, franchises, or other financial instruments, particularly in jurisdictions where such activity would be unlawful.
All content is of a general nature and may not address the specific circumstances of any individual or entity. It is not a substitute for professional advice or services. Any actions you take based on the information provided here are strictly at your own risk. You accept full responsibility for any decisions or outcomes arising from your use of this website and agree to release us from any liability in connection with your use of, or reliance upon, the content or products found herein.