
|
Miniso Group Holding Limited (MNSO) Avaliação DCF |
Totalmente Editável: Adapte-Se Às Suas Necessidades No Excel Ou Planilhas
Design Profissional: Modelos Confiáveis E Padrão Da Indústria
Pré-Construídos Para Uso Rápido E Eficiente
Compatível com MAC/PC, totalmente desbloqueado
Não É Necessária Experiência; Fácil De Seguir
MINISO Group Holding Limited (MNSO) Bundle
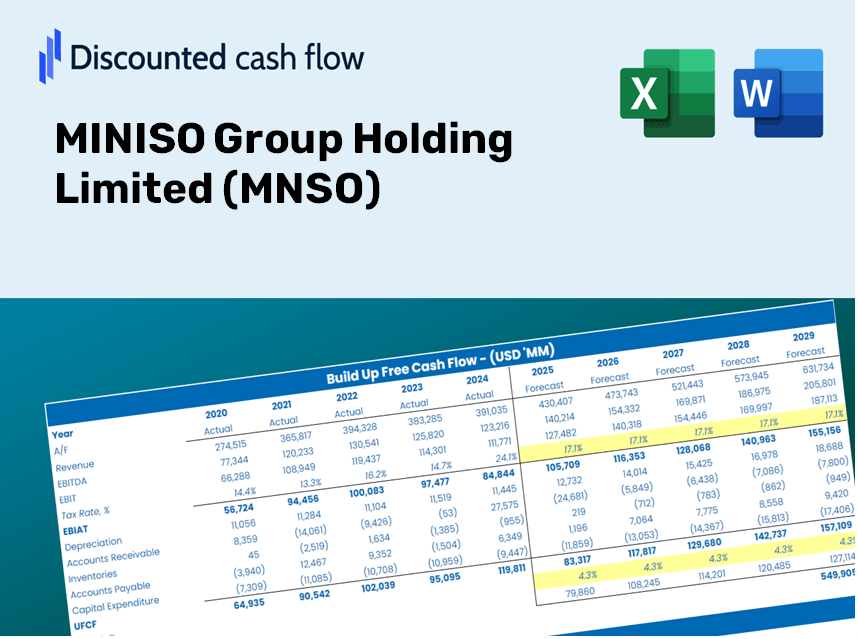
Obtenha informações sobre o seu Miniso Group Holding Limited (MNSO) Analysis com nossa calculadora DCF de última geração! Pré -carregado com dados reais (MNSO), este modelo do Excel permite ajustar as previsões e suposições para determinar com precisão o valor intrínseco do Miniso Group Holding Limited.
What You Will Receive
- Authentic MNSO Financial Data: Pre-loaded with MINISO Group Holding Limited’s historical and projected data for accurate analysis.
- Completely Customizable Template: Easily adjust key inputs such as revenue growth, WACC, and EBITDA percentage.
- Instant Calculations: Observe real-time updates of MINISO’s intrinsic value as you make adjustments.
- Professional Valuation Tool: Tailored for investors, analysts, and consultants aiming for precise DCF outcomes.
- Intuitive Design: Straightforward layout and clear guidelines suitable for all levels of expertise.
Key Features
- Authentic MINISO Financials: Gain access to reliable pre-loaded historical data and future forecasts specific to MINISO Group Holding Limited (MNSO).
- Adjustable Forecast Assumptions: Modify highlighted fields such as WACC, growth rates, and profit margins to suit your analysis.
- Real-Time Calculations: Enjoy automatic updates for DCF, Net Present Value (NPV), and cash flow assessments.
- User-Friendly Dashboard: View clear charts and summaries that help illustrate your valuation outcomes.
- Designed for All Levels: An intuitive layout tailored for investors, CFOs, and consultants, making it accessible for both novices and experts.
How It Works
- Step 1: Download the Excel file.
- Step 2: Examine the pre-filled financial data and projections for MINISO Group Holding Limited (MNSO).
- Step 3: Adjust key inputs such as revenue growth, WACC, and tax rates (highlighted cells).
- Step 4: Observe the DCF model refresh in real-time as you modify your assumptions.
- Step 5: Evaluate the outputs and leverage the findings for your investment strategies.
Why Choose This Calculator for MINISO Group Holding Limited (MNSO)?
- User-Friendly Interface: Tailored for both novices and seasoned users.
- Customizable Inputs: Effortlessly adjust variables to fit your financial analysis.
- Real-Time Adjustments: Witness immediate changes in MINISO’s valuation as you modify inputs.
- Quick Setup: Comes preloaded with MINISO’s actual financial metrics for rapid assessments.
- Widely Adopted: Favored by investors and analysts for making strategic decisions.
Who Can Benefit from MINISO Group Holding Limited (MNSO)?
- Investors: Leverage a sophisticated valuation tool to make informed investment choices.
- Financial Analysts: Streamline your workflow with a customizable DCF model tailored for ease of use.
- Consultants: Effortlessly modify the template for impactful client presentations or detailed reports.
- Finance Enthusiasts: Enhance your grasp of valuation methods through practical, real-world examples.
- Educators and Students: Utilize it as a hands-on educational resource in finance-related courses.
Contents of the Template
- In-Depth DCF Model: An editable template featuring comprehensive valuation calculations.
- Current Financial Data: MINISO Group Holding Limited’s (MNSO) historical and forecasted financials preloaded for evaluation.
- Adjustable Variables: Modify WACC, growth rates, and tax assumptions to explore various scenarios.
- Complete Financial Statements: Detailed annual and quarterly reports for enhanced insights.
- Essential Ratios: Built-in metrics for assessing profitability, efficiency, and leverage.
- Interactive Dashboard with Visual Outputs: Graphs and tables that present clear, actionable insights.
Disclaimer
All information, articles, and product details provided on this website are for general informational and educational purposes only. We do not claim any ownership over, nor do we intend to infringe upon, any trademarks, copyrights, logos, brand names, or other intellectual property mentioned or depicted on this site. Such intellectual property remains the property of its respective owners, and any references here are made solely for identification or informational purposes, without implying any affiliation, endorsement, or partnership.
We make no representations or warranties, express or implied, regarding the accuracy, completeness, or suitability of any content or products presented. Nothing on this website should be construed as legal, tax, investment, financial, medical, or other professional advice. In addition, no part of this site—including articles or product references—constitutes a solicitation, recommendation, endorsement, advertisement, or offer to buy or sell any securities, franchises, or other financial instruments, particularly in jurisdictions where such activity would be unlawful.
All content is of a general nature and may not address the specific circumstances of any individual or entity. It is not a substitute for professional advice or services. Any actions you take based on the information provided here are strictly at your own risk. You accept full responsibility for any decisions or outcomes arising from your use of this website and agree to release us from any liability in connection with your use of, or reliance upon, the content or products found herein.