
|
MOIL LIMITED (MOIL.NS) Avaliação DCF |
Totalmente Editável: Adapte-Se Às Suas Necessidades No Excel Ou Planilhas
Design Profissional: Modelos Confiáveis E Padrão Da Indústria
Pré-Construídos Para Uso Rápido E Eficiente
Compatível com MAC/PC, totalmente desbloqueado
Não É Necessária Experiência; Fácil De Seguir
MOIL Limited (MOIL.NS) Bundle
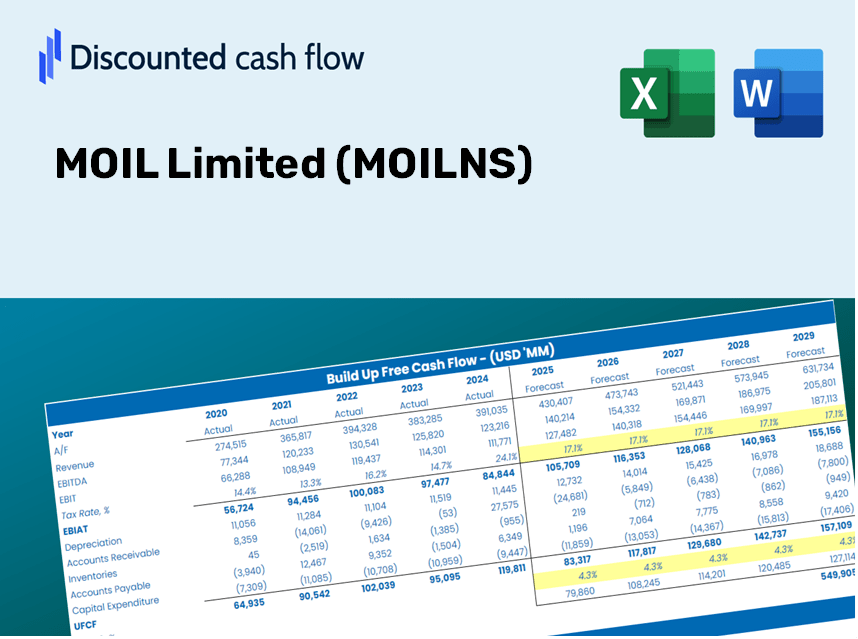
Simplifique a avaliação limitada do MOIL com esta calculadora DCF personalizável! Apresentando financeiras limitadas do MOIL Real e insumos de previsão ajustáveis, você pode testar cenários e descobrir o valor justo limitado do MOIL em minutos.
Discounted Cash Flow (DCF) - (USD MM)
| Year | AY1 2021 |
AY2 2022 |
AY3 2023 |
AY4 2024 |
AY5 2025 |
FY1 2026 |
FY2 2027 |
FY3 2028 |
FY4 2029 |
FY5 2030 |
|---|---|---|---|---|---|---|---|---|---|---|
| Revenue | 11,773.8 | 14,363.0 | 13,346.3 | 14,425.2 | 15,849.4 | 17,151.8 | 18,561.3 | 20,086.5 | 21,737.1 | 23,523.4 |
| Revenue Growth, % | 0 | 21.99 | -7.08 | 8.08 | 9.87 | 8.22 | 8.22 | 8.22 | 8.22 | 8.22 |
| EBITDA | 3,400.2 | 6,269.1 | 3,781.2 | 5,312.5 | 5,275.4 | 5,864.9 | 6,346.9 | 6,868.4 | 7,432.8 | 8,043.6 |
| EBITDA, % | 28.88 | 43.65 | 28.33 | 36.83 | 33.28 | 34.19 | 34.19 | 34.19 | 34.19 | 34.19 |
| Depreciation | 999.0 | 1,036.2 | 1,143.4 | 1,442.5 | 1,521.3 | 1,504.7 | 1,628.4 | 1,762.2 | 1,907.0 | 2,063.7 |
| Depreciation, % | 8.49 | 7.21 | 8.57 | 10 | 9.6 | 8.77 | 8.77 | 8.77 | 8.77 | 8.77 |
| EBIT | 2,401.1 | 5,232.9 | 2,637.8 | 3,870.0 | 3,754.1 | 4,360.2 | 4,718.5 | 5,106.2 | 5,525.8 | 5,979.9 |
| EBIT, % | 20.39 | 36.43 | 19.76 | 26.83 | 23.69 | 25.42 | 25.42 | 25.42 | 25.42 | 25.42 |
| Total Cash | 19,275.1 | 10,691.5 | 8,910.4 | 8,405.2 | 9,699.1 | 12,372.1 | 13,388.7 | 14,488.9 | 15,679.6 | 16,968.0 |
| Total Cash, percent | .0 | .0 | .0 | .0 | .0 | .0 | .0 | .0 | .0 | .0 |
| Account Receivables | 3,050.5 | 2,361.5 | 1,433.4 | 2,974.0 | 1,491.9 | 2,851.3 | 3,085.6 | 3,339.2 | 3,613.6 | 3,910.5 |
| Account Receivables, % | 25.91 | 16.44 | 10.74 | 20.62 | 9.41 | 16.62 | 16.62 | 16.62 | 16.62 | 16.62 |
| Inventories | 1,100.8 | 1,001.2 | 1,702.4 | 2,124.8 | 2,885.0 | 2,127.1 | 2,301.9 | 2,491.0 | 2,695.7 | 2,917.3 |
| Inventories, % | 9.35 | 6.97 | 12.76 | 14.73 | 18.2 | 12.4 | 12.4 | 12.4 | 12.4 | 12.4 |
| Accounts Payable | 289.9 | 252.3 | 381.1 | 460.5 | 460.5 | 451.8 | 489.0 | 529.1 | 572.6 | 619.7 |
| Accounts Payable, % | 2.46 | 1.76 | 2.86 | 3.19 | 2.91 | 2.63 | 2.63 | 2.63 | 2.63 | 2.63 |
| Capital Expenditure | -1,366.6 | -2,302.2 | -2,487.7 | -3,160.9 | -3,219.5 | -3,035.9 | -3,285.4 | -3,555.4 | -3,847.5 | -4,163.7 |
| Capital Expenditure, % | -11.61 | -16.03 | -18.64 | -21.91 | -20.31 | -17.7 | -17.7 | -17.7 | -17.7 | -17.7 |
| Tax Rate, % | 21.6 | 21.6 | 21.6 | 21.6 | 21.6 | 21.6 | 21.6 | 21.6 | 21.6 | 21.6 |
| EBITAT | 1,766.3 | 3,769.8 | 1,976.4 | 2,933.4 | 2,943.2 | 3,267.8 | 3,536.3 | 3,826.9 | 4,141.3 | 4,481.7 |
| Depreciation | ||||||||||
| Changes in Account Receivables | ||||||||||
| Changes in Inventories | ||||||||||
| Changes in Accounts Payable | ||||||||||
| Capital Expenditure | ||||||||||
| UFCF | -2,462.7 | 3,254.8 | 987.9 | -668.6 | 1,967.0 | 1,126.3 | 1,507.3 | 1,631.2 | 1,765.2 | 1,910.3 |
| WACC, % | 5.98 | 5.98 | 5.98 | 5.98 | 5.98 | 5.98 | 5.98 | 5.98 | 5.98 | 5.98 |
| PV UFCF | ||||||||||
| SUM PV UFCF | 6,602.8 | |||||||||
| Long Term Growth Rate, % | 3.50 | |||||||||
| Free cash flow (T + 1) | 1,977 | |||||||||
| Terminal Value | 79,659 | |||||||||
| Present Terminal Value | 59,576 | |||||||||
| Enterprise Value | 66,179 | |||||||||
| Net Debt | -28 | |||||||||
| Equity Value | 66,207 | |||||||||
| Diluted Shares Outstanding, MM | 203 | |||||||||
| Equity Value Per Share | 325.37 |
What You Will Receive
- Genuine MOIL Financials: Access to both historical and projected data for precise valuation.
- Customizable Parameters: Adjust WACC, tax rates, revenue growth, and capital investments.
- Automatic Calculations: Intrinsic value and NPV are computed in real-time.
- Scenario Analysis: Explore various scenarios to assess MOIL's future performance.
- User-Friendly Design: Tailored for industry professionals while remaining accessible to newcomers.
Key Features
- 🔍 Real-Life MOIL Limited Financials: Pre-loaded historical and projected data for MOIL Limited (MOILNS).
- ✏️ Fully Customizable Inputs: Modify all essential parameters (highlighted cells) such as WACC, growth %, and tax rates.
- 📊 Professional DCF Valuation: Integrated formulas compute MOIL’s intrinsic value utilizing the Discounted Cash Flow method.
- ⚡ Instant Results: Immediately visualize MOIL’s valuation upon making adjustments.
- Scenario Analysis: Evaluate and contrast different financial assumptions side-by-side.
How It Works
- Step 1: Download the prebuilt Excel template featuring MOIL Limited’s data.
- Step 2: Review the pre-filled sheets to familiarize yourself with the key metrics.
- Step 3: Modify forecasts and assumptions in the editable yellow cells (WACC, growth, margins).
- Step 4: Instantly see the recalculated results, including MOIL Limited’s intrinsic value.
- Step 5: Utilize the outputs to make informed investment decisions or create reports.
Why Choose This Calculator for MOIL Limited (MOILNS)?
- User-Friendly Interface: Perfect for both novice and experienced users.
- Customizable Inputs: Easily adjust parameters to suit your analytical needs.
- Real-Time Updates: Watch MOIL Limited's valuation change as you modify inputs.
- Preloaded Data: Comes ready with MOIL Limited's actual financial information for swift analysis.
- Relied Upon by Experts: Frequently utilized by investors and analysts for sound decision-making.
Who Can Benefit from MOIL Limited (MOILNS)?
- Finance Students: Discover valuation methods and practice them with actual data.
- Academics: Utilize industry-standard models in your teaching or research initiatives.
- Investors: Validate your hypotheses and assess valuation results for MOIL Limited (MOILNS) stocks.
- Analysts: Enhance your efficiency with a ready-to-use, customizable DCF model.
- Small Business Owners: Understand the analytical approaches used for large public firms like MOIL Limited (MOILNS).
Contents of the Template
- Historical Data: Provides MOIL Limited's past financial performance and baseline estimates.
- DCF and Levered DCF Models: Comprehensive templates for determining the intrinsic value of MOIL Limited (MOILNS).
- WACC Sheet: Pre-calculated metrics for Weighted Average Cost of Capital.
- Editable Inputs: Adjust essential factors such as growth rates, EBITDA %, and CAPEX assumptions.
- Quarterly and Annual Statements: Thorough analysis of MOIL Limited's financial data.
- Interactive Dashboard: Dynamically visualize valuation outcomes and forecasts.
Disclaimer
All information, articles, and product details provided on this website are for general informational and educational purposes only. We do not claim any ownership over, nor do we intend to infringe upon, any trademarks, copyrights, logos, brand names, or other intellectual property mentioned or depicted on this site. Such intellectual property remains the property of its respective owners, and any references here are made solely for identification or informational purposes, without implying any affiliation, endorsement, or partnership.
We make no representations or warranties, express or implied, regarding the accuracy, completeness, or suitability of any content or products presented. Nothing on this website should be construed as legal, tax, investment, financial, medical, or other professional advice. In addition, no part of this site—including articles or product references—constitutes a solicitation, recommendation, endorsement, advertisement, or offer to buy or sell any securities, franchises, or other financial instruments, particularly in jurisdictions where such activity would be unlawful.
All content is of a general nature and may not address the specific circumstances of any individual or entity. It is not a substitute for professional advice or services. Any actions you take based on the information provided here are strictly at your own risk. You accept full responsibility for any decisions or outcomes arising from your use of this website and agree to release us from any liability in connection with your use of, or reliance upon, the content or products found herein.