
|
Motilal Oswal Financial Services Limited (MOTILALOFS.NS) Avaliação DCF |
Totalmente Editável: Adapte-Se Às Suas Necessidades No Excel Ou Planilhas
Design Profissional: Modelos Confiáveis E Padrão Da Indústria
Pré-Construídos Para Uso Rápido E Eficiente
Compatível com MAC/PC, totalmente desbloqueado
Não É Necessária Experiência; Fácil De Seguir
Motilal Oswal Financial Services Limited (MOTILALOFS.NS) Bundle
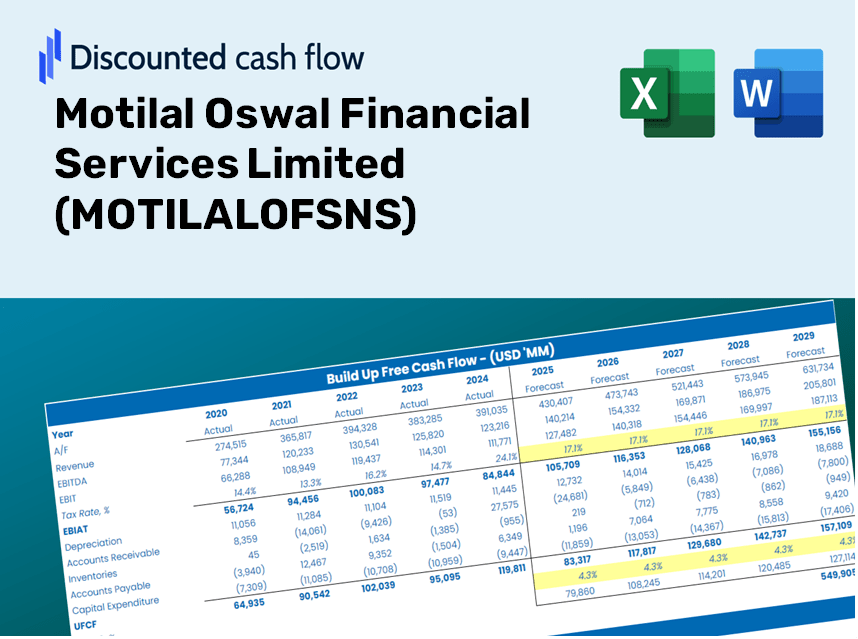
Projetado para precisão, nossa calculadora DCF (MotilaloFSNS) capacita você a avaliar a avaliação da Motilal Oswal Financial Services Limited com dados financeiros atualizados e completa flexibilidade para modificar todos os parâmetros essenciais para projeções mais precisas.
Discounted Cash Flow (DCF) - (USD MM)
| Year | AY1 2021 |
AY2 2022 |
AY3 2023 |
AY4 2024 |
AY5 2025 |
FY1 2026 |
FY2 2027 |
FY3 2028 |
FY4 2029 |
FY5 2030 |
|---|---|---|---|---|---|---|---|---|---|---|
| Revenue | 31,338.0 | 36,675.6 | 38,189.4 | 51,743.7 | 69,996.6 | 86,083.2 | 105,866.8 | 130,197.0 | 160,118.8 | 196,917.3 |
| Revenue Growth, % | 0 | 17.03 | 4.13 | 35.49 | 35.28 | 22.98 | 22.98 | 22.98 | 22.98 | 22.98 |
| EBITDA | 20,288.3 | 21,312.1 | 18,942.0 | 40,905.6 | 46,234.8 | 54,672.7 | 67,237.5 | 82,690.0 | 101,693.8 | 125,065.1 |
| EBITDA, % | 64.74 | 58.11 | 49.6 | 79.05 | 66.05 | 63.51 | 63.51 | 63.51 | 63.51 | 63.51 |
| Depreciation | 475.2 | 482.6 | 583.8 | 825.8 | 987.6 | 1,268.5 | 1,560.0 | 1,918.5 | 2,359.4 | 2,901.7 |
| Depreciation, % | 1.52 | 1.32 | 1.53 | 1.6 | 1.41 | 1.47 | 1.47 | 1.47 | 1.47 | 1.47 |
| EBIT | 19,813.1 | 20,829.5 | 18,358.2 | 40,079.8 | 45,247.2 | 53,404.2 | 65,677.5 | 80,771.5 | 99,334.4 | 122,163.4 |
| EBIT, % | 63.22 | 56.79 | 48.07 | 77.46 | 64.64 | 62.04 | 62.04 | 62.04 | 62.04 | 62.04 |
| Total Cash | 24,417.2 | 39,787.3 | 88,369.1 | 127,510.4 | 104,977.3 | 82,281.0 | 101,190.8 | 124,446.4 | 153,046.6 | 188,219.7 |
| Total Cash, percent | .0 | .0 | .0 | .0 | .0 | .0 | .0 | .0 | .0 | .0 |
| Account Receivables | 9,309.8 | 10,033.2 | 10,460.1 | 19,182.0 | 128,550.5 | 38,139.2 | 46,904.4 | 57,683.9 | 70,940.8 | 87,244.4 |
| Account Receivables, % | 29.71 | 27.36 | 27.39 | 37.07 | 183.65 | 44.31 | 44.31 | 44.31 | 44.31 | 44.31 |
| Inventories | 3,977.5 | 24,695.1 | 71,038.3 | .0 | .0 | 30,994.4 | 38,117.6 | 46,877.7 | 57,651.2 | 70,900.5 |
| Inventories, % | 12.69 | 67.33 | 186.02 | 0 | 0 | 36.01 | 36.01 | 36.01 | 36.01 | 36.01 |
| Accounts Payable | 27,767.9 | 34,508.1 | 32,501.6 | 53,124.2 | 53,207.6 | 76,410.7 | 93,971.3 | 115,567.8 | 142,127.5 | 174,791.2 |
| Accounts Payable, % | 88.61 | 94.09 | 85.11 | 102.67 | 76.01 | 88.76 | 88.76 | 88.76 | 88.76 | 88.76 |
| Capital Expenditure | -646.7 | -545.4 | -1,675.4 | -1,507.7 | -2,842.5 | -2,567.4 | -3,157.5 | -3,883.1 | -4,775.5 | -5,873.1 |
| Capital Expenditure, % | -2.06 | -1.49 | -4.39 | -2.91 | -4.06 | -2.98 | -2.98 | -2.98 | -2.98 | -2.98 |
| Tax Rate, % | 22.46 | 22.46 | 22.46 | 22.46 | 22.46 | 22.46 | 22.46 | 22.46 | 22.46 | 22.46 |
| EBITAT | 16,427.8 | 16,884.4 | 13,768.7 | 32,269.5 | 35,084.7 | 42,405.9 | 52,151.6 | 64,137.0 | 78,876.9 | 97,004.4 |
| Depreciation | ||||||||||
| Changes in Account Receivables | ||||||||||
| Changes in Inventories | ||||||||||
| Changes in Accounts Payable | ||||||||||
| Capital Expenditure | ||||||||||
| UFCF | 30,736.9 | 2,120.8 | -36,099.5 | 114,526.6 | -76,055.3 | 123,726.8 | 52,226.5 | 64,229.1 | 78,990.3 | 97,143.8 |
| WACC, % | 5.21 | 5.18 | 5.07 | 5.17 | 5.11 | 5.15 | 5.15 | 5.15 | 5.15 | 5.15 |
| PV UFCF | ||||||||||
| SUM PV UFCF | 360,371.8 | |||||||||
| Long Term Growth Rate, % | 2.00 | |||||||||
| Free cash flow (T + 1) | 99,087 | |||||||||
| Terminal Value | 3,149,103 | |||||||||
| Present Terminal Value | 2,450,263 | |||||||||
| Enterprise Value | 2,810,635 | |||||||||
| Net Debt | 81,314 | |||||||||
| Equity Value | 2,729,321 | |||||||||
| Diluted Shares Outstanding, MM | 599 | |||||||||
| Equity Value Per Share | 4,553.66 |
What You Will Receive
- Customizable Excel Template: A fully adjustable Excel-based DCF Calculator featuring pre-populated financial data for MOTILALOFSNS.
- Accurate Financial Data: Access to historical figures and projected estimates (highlighted in the yellow cells).
- Adjustable Forecasting: Modify key assumptions such as revenue growth, EBITDA %, and WACC.
- Instant Calculations: Quickly observe how your inputs affect the valuation of Motilal Oswal Financial Services Limited.
- Professional Resource: Designed for investors, CFOs, consultants, and financial analysts.
- User-Friendly Interface: Organized for easy navigation, complete with step-by-step guidance.
Key Features
- 🔍 Real-Life MOTILALOFSNS Financials: Pre-filled historical and projected data for Motilal Oswal Financial Services Limited.
- ✏️ Fully Customizable Inputs: Modify all key parameters (yellow cells) such as WACC, growth %, and tax rates.
- 📊 Professional DCF Valuation: Integrated formulas determine Motilal Oswal’s intrinsic value using the Discounted Cash Flow method.
- ⚡ Instant Results: Visualize Motilal Oswal’s valuation immediately after making adjustments.
- Scenario Analysis: Evaluate and compare outcomes for different financial assumptions side-by-side.
How It Works
- Step 1: Download the prebuilt Excel template featuring Motilal Oswal Financial Services Limited’s (MOTILALOFSNS) data.
- Step 2: Review the pre-filled sheets to familiarize yourself with essential metrics.
- Step 3: Modify forecasts and assumptions in the editable yellow cells (WACC, growth, and margins).
- Step 4: Instantly access the recalibrated results, including the intrinsic value of Motilal Oswal Financial Services Limited (MOTILALOFSNS).
- Step 5: Utilize the outputs to make informed investment decisions or create detailed reports.
Why Choose Motilal Oswal Financial Services Limited (MOTILALOFSNS)?
- All-in-One Solution: Offers a suite of tools including DCF, WACC, and financial ratio analyses comprehensively.
- Flexible Inputs: Modify the highlighted fields to explore different financial scenarios.
- In-Depth Analysis: Automatically computes the intrinsic value and Net Present Value for your investments.
- Ready-to-Use Data: Comes with historical and projected data for reliable analysis.
- Expert Grade: Perfect for financial analysts, investors, and consultants seeking high-quality insights.
Who Can Benefit from MOTILALOFSNS?
- Individual Investors: Gain valuable insights for making informed decisions on your investments with MOTILALOFSNS.
- Financial Analysts: Enhance your analysis with accessible financial models tailored for seamless valuation.
- Consultants: Provide clients with accurate and timely valuation reports using MOTILALOFSNS tools.
- Business Owners: Learn the valuation methodologies of major players to refine your own business strategies.
- Finance Students: Acquire practical knowledge of valuation practices through real-life data and examples from MOTILALOFSNS.
Contents of the Template
- Pre-Filled Data: Contains historical financials and forecasts for Motilal Oswal Financial Services Limited (MOTILALOFSNS).
- Discounted Cash Flow Model: An editable DCF valuation model featuring automatic calculations.
- Weighted Average Cost of Capital (WACC): A dedicated section for calculating WACC using custom inputs.
- Key Financial Ratios: Evaluate Motilal Oswal's profitability, efficiency, and leverage.
- Customizable Inputs: Easily modify revenue growth, margins, and tax rates.
- User-Friendly Dashboard: Visual summaries in charts and tables highlighting key valuation outcomes.
Disclaimer
All information, articles, and product details provided on this website are for general informational and educational purposes only. We do not claim any ownership over, nor do we intend to infringe upon, any trademarks, copyrights, logos, brand names, or other intellectual property mentioned or depicted on this site. Such intellectual property remains the property of its respective owners, and any references here are made solely for identification or informational purposes, without implying any affiliation, endorsement, or partnership.
We make no representations or warranties, express or implied, regarding the accuracy, completeness, or suitability of any content or products presented. Nothing on this website should be construed as legal, tax, investment, financial, medical, or other professional advice. In addition, no part of this site—including articles or product references—constitutes a solicitation, recommendation, endorsement, advertisement, or offer to buy or sell any securities, franchises, or other financial instruments, particularly in jurisdictions where such activity would be unlawful.
All content is of a general nature and may not address the specific circumstances of any individual or entity. It is not a substitute for professional advice or services. Any actions you take based on the information provided here are strictly at your own risk. You accept full responsibility for any decisions or outcomes arising from your use of this website and agree to release us from any liability in connection with your use of, or reliance upon, the content or products found herein.