
|
Marine Products Corporation (MPX) Avaliação DCF |
Totalmente Editável: Adapte-Se Às Suas Necessidades No Excel Ou Planilhas
Design Profissional: Modelos Confiáveis E Padrão Da Indústria
Pré-Construídos Para Uso Rápido E Eficiente
Compatível com MAC/PC, totalmente desbloqueado
Não É Necessária Experiência; Fácil De Seguir
Marine Products Corporation (MPX) Bundle
Simplifique a avaliação da Marine Products Corporation (MPX) com esta calculadora DCF personalizável! Com o Real Marine Products Corporation (MPX) e os insumos de previsão ajustável, você pode testar cenários e descobrir valor justo da Marine Products Corporation (MPX) em minutos.
What You Will Get
- Real MPX Financial Data: Pre-filled with Marine Products Corporation’s historical and projected data for precise analysis.
- Fully Editable Template: Modify key inputs like revenue growth, WACC, and EBITDA % with ease.
- Automatic Calculations: See Marine Products Corporation’s intrinsic value update instantly based on your changes.
- Professional Valuation Tool: Designed for investors, analysts, and consultants seeking accurate DCF results.
- User-Friendly Design: Simple structure and clear instructions for all experience levels.
Key Features
- Comprehensive Financial Data: Marine Products Corporation's (MPX) historical financial statements and pre-filled projections.
- Customizable Parameters: Adjust WACC, tax rates, revenue growth, and EBITDA margins as needed.
- Real-Time Valuation: Observe the recalculation of Marine Products Corporation's (MPX) intrinsic value instantly.
- Intuitive Visualizations: Dashboard graphs present valuation outcomes and essential metrics clearly.
- Designed for Precision: A reliable resource for analysts, investors, and finance professionals.
How It Works
- Step 1: Download the Excel file for Marine Products Corporation (MPX).
- Step 2: Review the pre-filled financial data and forecasts for Marine Products Corporation (MPX).
- Step 3: Adjust key inputs such as revenue growth, WACC, and tax rates (highlighted cells) for Marine Products Corporation (MPX).
- Step 4: Observe the DCF model update in real-time as you modify your assumptions for Marine Products Corporation (MPX).
- Step 5: Evaluate the outputs and leverage the results for your investment decisions regarding Marine Products Corporation (MPX).
Why Choose the MPX Calculator?
- Save Time: Skip the hassle of building a DCF model from the ground up – it's ready for immediate use.
- Enhance Accuracy: Dependable financial data and formulas minimize valuation errors.
- Fully Customizable: Adjust the model to align with your own assumptions and forecasts.
- Easy to Understand: Intuitive charts and outputs simplify result analysis.
- Endorsed by Professionals: Crafted for experts who prioritize precision and user-friendliness.
Who Should Use Marine Products Corporation (MPX)?
- Marine Enthusiasts: Discover the latest trends and innovations in the boating industry.
- Students: Explore marine engineering concepts and their applications in real-world scenarios.
- Investors: Evaluate investment opportunities and performance metrics related to Marine Products Corporation (MPX).
- Dealers: Enhance your sales strategies with insights from a leading manufacturer in the marine sector.
- Recreational Boaters: Understand the features and benefits of various products offered by Marine Products Corporation (MPX).
What the Template Contains
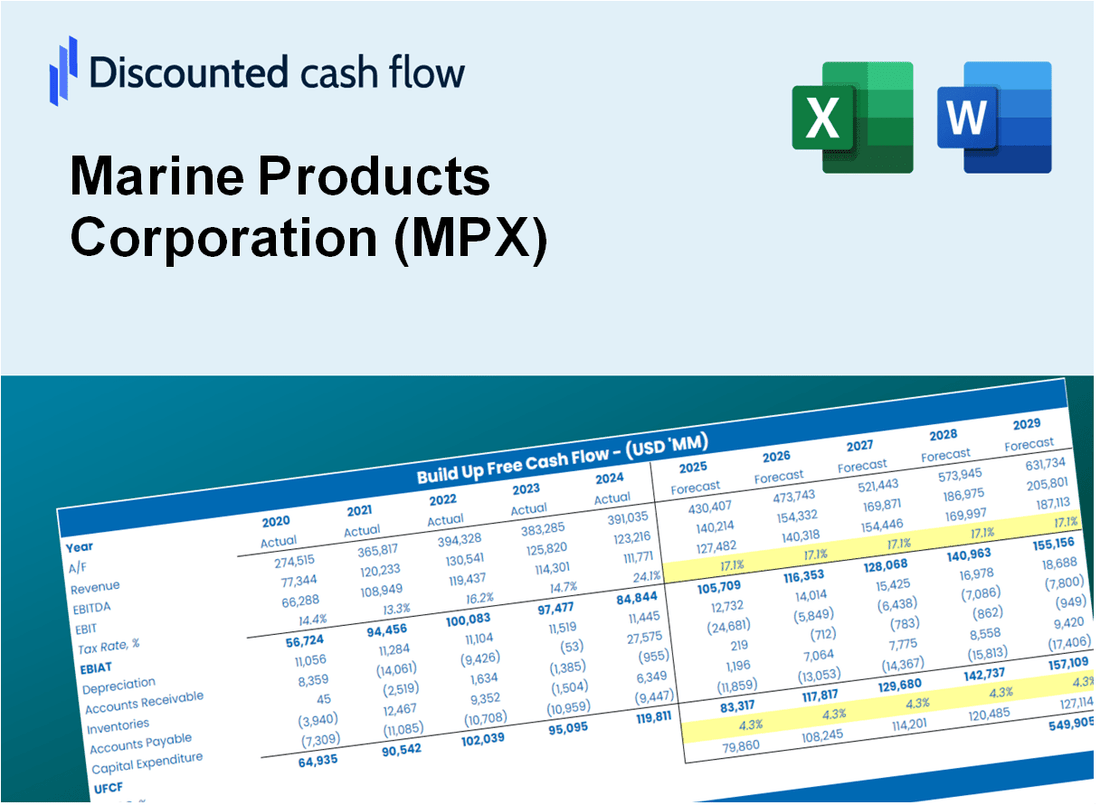
- Operating and Balance Sheet Data: Pre-filled Marine Products Corporation (MPX) historical data and forecasts, including revenue, EBITDA, EBIT, and capital expenditures.
- WACC Calculation: A dedicated sheet for Weighted Average Cost of Capital (WACC), including parameters like Beta, risk-free rate, and share price.
- DCF Valuation (Unlevered and Levered): Editable Discounted Cash Flow models showing intrinsic value with detailed calculations.
- Financial Statements: Pre-loaded financial statements (annual and quarterly) to support analysis.
- Key Ratios: Includes profitability, leverage, and efficiency ratios for Marine Products Corporation (MPX).
- Dashboard and Charts: Visual summary of valuation outputs and assumptions to analyze results easily.
Disclaimer
All information, articles, and product details provided on this website are for general informational and educational purposes only. We do not claim any ownership over, nor do we intend to infringe upon, any trademarks, copyrights, logos, brand names, or other intellectual property mentioned or depicted on this site. Such intellectual property remains the property of its respective owners, and any references here are made solely for identification or informational purposes, without implying any affiliation, endorsement, or partnership.
We make no representations or warranties, express or implied, regarding the accuracy, completeness, or suitability of any content or products presented. Nothing on this website should be construed as legal, tax, investment, financial, medical, or other professional advice. In addition, no part of this site—including articles or product references—constitutes a solicitation, recommendation, endorsement, advertisement, or offer to buy or sell any securities, franchises, or other financial instruments, particularly in jurisdictions where such activity would be unlawful.
All content is of a general nature and may not address the specific circumstances of any individual or entity. It is not a substitute for professional advice or services. Any actions you take based on the information provided here are strictly at your own risk. You accept full responsibility for any decisions or outcomes arising from your use of this website and agree to release us from any liability in connection with your use of, or reliance upon, the content or products found herein.