
|
Avaliação DCF da Monroe Capital Corporation (MRCC) |
Totalmente Editável: Adapte-Se Às Suas Necessidades No Excel Ou Planilhas
Design Profissional: Modelos Confiáveis E Padrão Da Indústria
Pré-Construídos Para Uso Rápido E Eficiente
Compatível com MAC/PC, totalmente desbloqueado
Não É Necessária Experiência; Fácil De Seguir
Monroe Capital Corporation (MRCC) Bundle
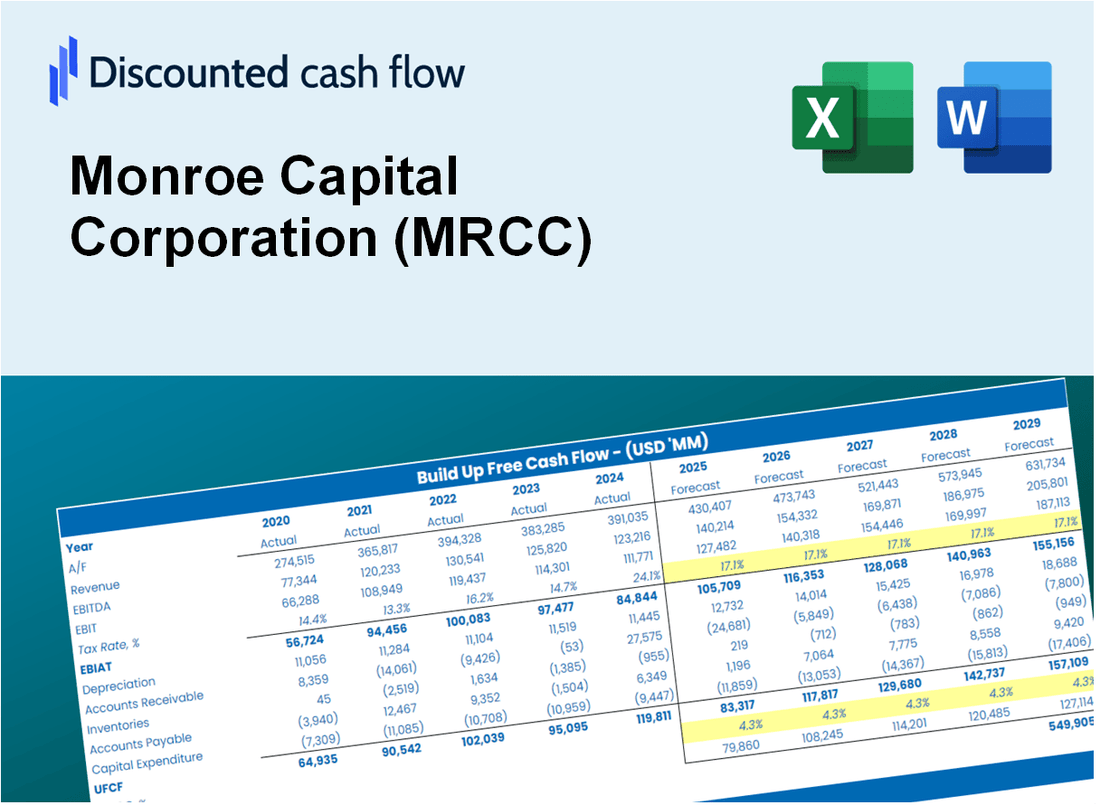
Obtenha uma visão da sua análise de avaliação da Monroe Capital Corporation (MRCC) com nossa poderosa calculadora DCF! Este modelo do Excel é pré -carregado com dados reais do MRCC, permitindo ajustar as previsões e suposições para um cálculo preciso do valor intrínseco da Monroe Capital Corporation.
Discounted Cash Flow (DCF) - (USD MM)
| Year | AY1 2020 |
AY2 2021 |
AY3 2022 |
AY4 2023 |
AY5 2024 |
FY1 2025 |
FY2 2026 |
FY3 2027 |
FY4 2028 |
FY5 2029 |
|---|---|---|---|---|---|---|---|---|---|---|
| Revenue | 22.3 | 54.0 | 19.4 | 27.0 | 35.2 | 44.4 | 56.1 | 70.9 | 89.5 | 113.1 |
| Revenue Growth, % | 0 | 142.06 | -64.01 | 38.87 | 30.33 | 26.3 | 26.3 | 26.3 | 26.3 | 26.3 |
| EBITDA | 2.0 | 32.7 | -1.4 | 1.2 | 10.2 | 8.5 | 10.8 | 13.6 | 17.1 | 21.7 |
| EBITDA, % | 9.03 | 60.6 | -7.1 | 4.36 | 28.86 | 19.15 | 19.15 | 19.15 | 19.15 | 19.15 |
| Depreciation | .0 | .0 | .0 | .0 | .0 | .0 | .0 | .0 | .0 | .0 |
| Depreciation, % | 0 | 0 | 0 | 0 | 0 | 0 | 0 | 0 | 0 | 0 |
| EBIT | 2.0 | 32.7 | -1.4 | 1.2 | 10.2 | 8.5 | 10.8 | 13.6 | 17.1 | 21.7 |
| EBIT, % | 9.03 | 60.6 | -7.1 | 4.36 | 28.86 | 19.15 | 19.15 | 19.15 | 19.15 | 19.15 |
| Total Cash | 6.8 | 2.6 | 5.5 | 5.0 | 9.0 | 9.5 | 12.0 | 15.2 | 19.2 | 24.3 |
| Total Cash, percent | .0 | .0 | .0 | .0 | .0 | .0 | .0 | .0 | .0 | .0 |
| Account Receivables | 4.6 | 9.5 | 16.5 | 19.3 | 23.5 | 23.2 | 29.3 | 37.0 | 46.8 | 59.1 |
| Account Receivables, % | 20.64 | 17.54 | 84.63 | 71.65 | 66.8 | 52.25 | 52.25 | 52.25 | 52.25 | 52.25 |
| Inventories | .0 | .0 | .0 | .0 | .0 | .0 | .0 | .0 | .0 | .0 |
| Inventories, % | 0 | 0 | 0 | 0 | 0 | 0 | 0 | 0 | 0 | 0 |
| Accounts Payable | 5.1 | 5.9 | 6.3 | 5.2 | 5.0 | 8.8 | 11.2 | 14.1 | 17.8 | 22.5 |
| Accounts Payable, % | 22.81 | 11.01 | 32.2 | 19.17 | 14.12 | 19.86 | 19.86 | 19.86 | 19.86 | 19.86 |
| Capital Expenditure | .0 | .0 | .0 | .0 | .0 | .0 | .0 | .0 | .0 | .0 |
| Capital Expenditure, % | 0 | 0 | 0 | 0 | 0 | 0 | 0 | 0 | 0 | 0 |
| Tax Rate, % | 4.45 | 4.45 | 4.45 | 4.45 | 4.45 | 4.45 | 4.45 | 4.45 | 4.45 | 4.45 |
| EBITAT | 1.6 | 32.5 | -2.8 | .4 | 9.7 | 6.9 | 8.8 | 11.1 | 14.0 | 17.7 |
| Depreciation | ||||||||||
| Changes in Account Receivables | ||||||||||
| Changes in Inventories | ||||||||||
| Changes in Accounts Payable | ||||||||||
| Capital Expenditure | ||||||||||
| UFCF | 2.1 | 28.4 | -9.5 | -3.6 | 5.3 | 11.1 | 5.0 | 6.3 | 7.9 | 10.0 |
| WACC, % | 6.48 | 7.37 | 7.42 | 3.94 | 7.19 | 6.48 | 6.48 | 6.48 | 6.48 | 6.48 |
| PV UFCF | ||||||||||
| SUM PV UFCF | 33.5 | |||||||||
| Long Term Growth Rate, % | 2.00 | |||||||||
| Free cash flow (T + 1) | 10 | |||||||||
| Terminal Value | 228 | |||||||||
| Present Terminal Value | 167 | |||||||||
| Enterprise Value | 200 | |||||||||
| Net Debt | 283 | |||||||||
| Equity Value | -82 | |||||||||
| Diluted Shares Outstanding, MM | 22 | |||||||||
| Equity Value Per Share | -3.81 |
What You Will Receive
- Customizable Excel Template: A fully adjustable Excel-based DCF Calculator featuring pre-populated financial data for Monroe Capital Corporation (MRCC).
- Real-World Financials: Access to historical performance data and forward-looking projections (highlighted in the yellow cells).
- Adaptive Forecasting: Modify key assumptions such as revenue growth, EBITDA percentage, and WACC.
- Instant Calculations: Quickly observe how your inputs affect the valuation of Monroe Capital Corporation (MRCC).
- Professional Resource: Designed for investors, CFOs, consultants, and financial analysts.
- User-Friendly Interface: Organized for clarity and simplicity, complete with step-by-step guidance.
Key Features
- Comprehensive DCF Calculator: Features detailed unlevered and levered DCF valuation models tailored for Monroe Capital Corporation (MRCC).
- WACC Calculator: Ready-to-use Weighted Average Cost of Capital sheet with adjustable inputs for personalized analysis.
- Customizable Forecast Assumptions: Easily adjust growth rates, capital expenditures, and discount rates to fit your analysis.
- Integrated Financial Ratios: Evaluate profitability, leverage, and efficiency ratios specifically for Monroe Capital Corporation (MRCC).
- Interactive Dashboard and Charts: Visual representations summarize essential valuation metrics for straightforward analysis.
How It Works
- Step 1: Download the prebuilt Excel template featuring Monroe Capital Corporation's (MRCC) data.
- Step 2: Review the populated sheets to familiarize yourself with the essential metrics.
- Step 3: Adjust forecasts and assumptions in the editable yellow cells (WACC, growth, margins).
- Step 4: Instantly see the recalculated results, including Monroe Capital Corporation's (MRCC) intrinsic value.
- Step 5: Make informed investment choices or create reports based on the results.
Why Choose This Calculator for Monroe Capital Corporation (MRCC)?
- User-Friendly Interface: Tailored for both novices and seasoned professionals.
- Customizable Inputs: Easily adjust parameters to suit your financial analysis.
- Real-Time Feedback: Watch Monroe Capital’s valuation update instantly as you change inputs.
- Preloaded Data: Comes with Monroe Capital’s actual financial metrics for immediate evaluation.
- Relied Upon by Experts: Utilized by investors and analysts for making well-informed choices.
Who Should Use Monroe Capital Corporation (MRCC)?
- Finance Students: Explore investment strategies and analyze real-world data related to Monroe Capital Corporation (MRCC).
- Academics: Integrate investment models and case studies featuring Monroe Capital Corporation (MRCC) into your research or teaching.
- Investors: Evaluate your investment strategies and assess the performance metrics of Monroe Capital Corporation (MRCC).
- Analysts: Enhance your analysis with a comprehensive, customizable financial model tailored for Monroe Capital Corporation (MRCC).
- Small Business Owners: Understand the financial landscape by examining how firms like Monroe Capital Corporation (MRCC) operate and are valued.
What the Template Contains
- Preloaded MRCC Data: Historical and projected financial data, including revenue, EBIT, and capital expenditures.
- DCF and WACC Models: Professional-grade sheets for calculating intrinsic value and Weighted Average Cost of Capital.
- Editable Inputs: Yellow-highlighted cells for adjusting revenue growth, tax rates, and discount rates.
- Financial Statements: Comprehensive annual and quarterly financials for deeper analysis.
- Key Ratios: Profitability, leverage, and efficiency ratios to evaluate performance.
- Dashboard and Charts: Visual summaries of valuation outcomes and assumptions.
Disclaimer
All information, articles, and product details provided on this website are for general informational and educational purposes only. We do not claim any ownership over, nor do we intend to infringe upon, any trademarks, copyrights, logos, brand names, or other intellectual property mentioned or depicted on this site. Such intellectual property remains the property of its respective owners, and any references here are made solely for identification or informational purposes, without implying any affiliation, endorsement, or partnership.
We make no representations or warranties, express or implied, regarding the accuracy, completeness, or suitability of any content or products presented. Nothing on this website should be construed as legal, tax, investment, financial, medical, or other professional advice. In addition, no part of this site—including articles or product references—constitutes a solicitation, recommendation, endorsement, advertisement, or offer to buy or sell any securities, franchises, or other financial instruments, particularly in jurisdictions where such activity would be unlawful.
All content is of a general nature and may not address the specific circumstances of any individual or entity. It is not a substitute for professional advice or services. Any actions you take based on the information provided here are strictly at your own risk. You accept full responsibility for any decisions or outcomes arising from your use of this website and agree to release us from any liability in connection with your use of, or reliance upon, the content or products found herein.