
|
Marker Therapeutics, Inc. (MRKR) DCF Avaliação |
Totalmente Editável: Adapte-Se Às Suas Necessidades No Excel Ou Planilhas
Design Profissional: Modelos Confiáveis E Padrão Da Indústria
Pré-Construídos Para Uso Rápido E Eficiente
Compatível com MAC/PC, totalmente desbloqueado
Não É Necessária Experiência; Fácil De Seguir
Marker Therapeutics, Inc. (MRKR) Bundle
Procurando avaliar o valor intrínseco da Marker Therapeutics, Inc. (MRKR)? Nossa calculadora DCF (MRKR) integra dados do mundo real com extensos recursos de personalização, permitindo refinar suas previsões e aprimorar suas opções de investimento.
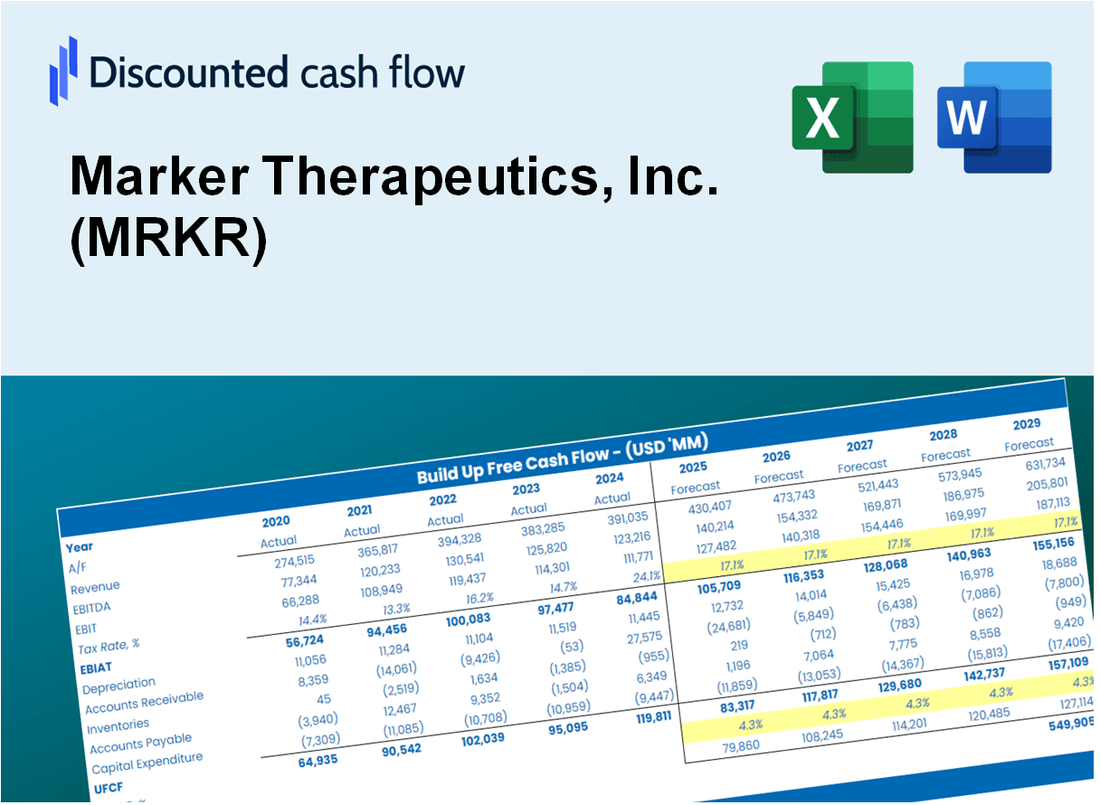
Discounted Cash Flow (DCF) - (USD MM)
| Year | AY1 2020 |
AY2 2021 |
AY3 2022 |
AY4 2023 |
AY5 2024 |
FY1 2025 |
FY2 2026 |
FY3 2027 |
FY4 2028 |
FY5 2029 |
|---|---|---|---|---|---|---|---|---|---|---|
| Revenue | .5 | 1.2 | 9.0 | 3.3 | 6.6 | 10.5 | 16.7 | 26.5 | 42.1 | 66.9 |
| Revenue Growth, % | 0 | 166.08 | 625.04 | -63.23 | 99.06 | 58.96 | 58.96 | 58.96 | 58.96 | 58.96 |
| EBITDA | -27.6 | -36.3 | -16.1 | -11.3 | -4.5 | -9.8 | -15.6 | -24.8 | -39.4 | -62.7 |
| EBITDA, % | -5919.21 | -2923.91 | -178.91 | -340.38 | -68.68 | -93.74 | -93.74 | -93.74 | -93.74 | -93.74 |
| Depreciation | 1.1 | 3.2 | 3.7 | 2.8 | .0 | 6.8 | 10.8 | 17.2 | 27.4 | 43.5 |
| Depreciation, % | 230.51 | 254.67 | 40.87 | 84.23 | 0 | 65.02 | 65.02 | 65.02 | 65.02 | 65.02 |
| EBIT | -28.7 | -39.5 | -19.8 | -14.1 | -4.5 | -9.8 | -15.6 | -24.8 | -39.4 | -62.7 |
| EBIT, % | -6149.73 | -3178.58 | -219.78 | -424.61 | -68.68 | -93.74 | -93.74 | -93.74 | -93.74 | -93.74 |
| Total Cash | 21.4 | 42.4 | 11.8 | 15.1 | 19.2 | 10.5 | 16.7 | 26.5 | 42.1 | 66.9 |
| Total Cash, percent | .0 | .0 | .0 | .0 | .0 | .0 | .0 | .0 | .0 | .0 |
| Account Receivables | 1.0 | .0 | 2.4 | 1.0 | 2.3 | 4.1 | 6.4 | 10.2 | 16.3 | 25.9 |
| Account Receivables, % | 214.35 | 0.01908213 | 26.67 | 31.04 | 35.6 | 38.67 | 38.67 | 38.67 | 38.67 | 38.67 |
| Inventories | .0 | .0 | .0 | -1.0 | .0 | -.6 | -1.0 | -1.6 | -2.5 | -4.0 |
| Inventories, % | 0 | 0 | 0 | -29.84 | 0 | -5.97 | -5.97 | -5.97 | -5.97 | -5.97 |
| Accounts Payable | 2.9 | 5.1 | 1.1 | 1.0 | 1.1 | 5.4 | 8.6 | 13.6 | 21.7 | 34.4 |
| Accounts Payable, % | 628.77 | 414.17 | 12.23 | 29.02 | 16.17 | 51.48 | 51.48 | 51.48 | 51.48 | 51.48 |
| Capital Expenditure | -10.4 | -3.1 | -4.9 | .0 | .0 | -5.3 | -8.5 | -13.5 | -21.5 | -34.1 |
| Capital Expenditure, % | -2233.99 | -252.1 | -54.92 | 0 | 0 | -50.98 | -50.98 | -50.98 | -50.98 | -50.98 |
| Tax Rate, % | -0.46812 | -0.46812 | -0.46812 | -0.46812 | -0.46812 | -0.46812 | -0.46812 | -0.46812 | -0.46812 | -0.46812 |
| EBITAT | -28.7 | -39.5 | -30.0 | -8.2 | -4.5 | -9.0 | -14.3 | -22.8 | -36.2 | -57.5 |
| Depreciation | ||||||||||
| Changes in Account Receivables | ||||||||||
| Changes in Inventories | ||||||||||
| Changes in Accounts Payable | ||||||||||
| Capital Expenditure | ||||||||||
| UFCF | -36.1 | -36.2 | -37.7 | -3.2 | -6.8 | -4.3 | -10.8 | -17.2 | -27.3 | -43.5 |
| WACC, % | 10.23 | 10.23 | 10.23 | 10.23 | 10.23 | 10.23 | 10.23 | 10.23 | 10.23 | 10.23 |
| PV UFCF | ||||||||||
| SUM PV UFCF | -70.9 | |||||||||
| Long Term Growth Rate, % | 2.00 | |||||||||
| Free cash flow (T + 1) | -44 | |||||||||
| Terminal Value | -539 | |||||||||
| Present Terminal Value | -331 | |||||||||
| Enterprise Value | -402 | |||||||||
| Net Debt | -19 | |||||||||
| Equity Value | -383 | |||||||||
| Diluted Shares Outstanding, MM | 9 | |||||||||
| Equity Value Per Share | -42.62 |
What You Will Get
- Real MRKR Financial Data: Pre-filled with Marker Therapeutics’ historical and projected data for precise analysis.
- Fully Editable Template: Modify key inputs like revenue growth, WACC, and EBITDA % with ease.
- Automatic Calculations: See Marker Therapeutics’ intrinsic value update instantly based on your changes.
- Professional Valuation Tool: Designed for investors, analysts, and consultants seeking accurate DCF results.
- User-Friendly Design: Simple structure and clear instructions for all experience levels.
Key Features
- Comprehensive Data: Marker Therapeutics’ historical financial reports and projected forecasts.
- Customizable Parameters: Adjust WACC, tax rates, revenue growth, and EBITDA margins as needed.
- Real-Time Insights: View Marker Therapeutics’ intrinsic value update instantly.
- Intuitive Visuals: Dashboard graphs illustrate valuation outcomes and essential metrics.
- Designed for Precision: A robust tool for analysts, investors, and finance professionals.
How It Works
- Step 1: Download the Excel file.
- Step 2: Review pre-entered Marker Therapeutics data (historical and projected).
- Step 3: Adjust key assumptions (yellow cells) based on your analysis.
- Step 4: View automatic recalculations for Marker Therapeutics’ intrinsic value.
- Step 5: Use the outputs for investment decisions or reporting.
Why Choose Marker Therapeutics, Inc. (MRKR)?
- Innovative Therapies: Pioneering treatments that utilize cutting-edge technology in immunotherapy.
- Strong Pipeline: A robust portfolio of clinical-stage assets aimed at addressing unmet medical needs.
- Expert Team: Led by seasoned professionals with extensive experience in biopharmaceutical development.
- Commitment to Quality: Adherence to the highest standards in research and manufacturing processes.
- Positive Impact: Focused on improving patient outcomes and enhancing the quality of life.
Who Should Use This Product?
- Healthcare Professionals: Understand advanced treatment methodologies and their implications using real-world data.
- Researchers: Integrate cutting-edge models into clinical studies or academic projects.
- Investors: Validate your investment hypotheses and assess valuation scenarios for Marker Therapeutics, Inc. (MRKR).
- Market Analysts: Enhance your analysis with a customizable financial model tailored for biotech firms.
- Biotech Entrepreneurs: Learn from the valuation strategies of established companies like Marker Therapeutics, Inc. (MRKR).
What the Template Contains
- Operating and Balance Sheet Data: Pre-filled Marker Therapeutics historical data and forecasts, including revenue, EBITDA, EBIT, and capital expenditures.
- WACC Calculation: A dedicated sheet for Weighted Average Cost of Capital (WACC), including parameters like Beta, risk-free rate, and share price.
- DCF Valuation (Unlevered and Levered): Editable Discounted Cash Flow models showing intrinsic value with detailed calculations.
- Financial Statements: Pre-loaded financial statements (annual and quarterly) to support analysis.
- Key Ratios: Includes profitability, leverage, and efficiency ratios for Marker Therapeutics, Inc. (MRKR).
- Dashboard and Charts: Visual summary of valuation outputs and assumptions to analyze results easily.
Disclaimer
All information, articles, and product details provided on this website are for general informational and educational purposes only. We do not claim any ownership over, nor do we intend to infringe upon, any trademarks, copyrights, logos, brand names, or other intellectual property mentioned or depicted on this site. Such intellectual property remains the property of its respective owners, and any references here are made solely for identification or informational purposes, without implying any affiliation, endorsement, or partnership.
We make no representations or warranties, express or implied, regarding the accuracy, completeness, or suitability of any content or products presented. Nothing on this website should be construed as legal, tax, investment, financial, medical, or other professional advice. In addition, no part of this site—including articles or product references—constitutes a solicitation, recommendation, endorsement, advertisement, or offer to buy or sell any securities, franchises, or other financial instruments, particularly in jurisdictions where such activity would be unlawful.
All content is of a general nature and may not address the specific circumstances of any individual or entity. It is not a substitute for professional advice or services. Any actions you take based on the information provided here are strictly at your own risk. You accept full responsibility for any decisions or outcomes arising from your use of this website and agree to release us from any liability in connection with your use of, or reliance upon, the content or products found herein.