
|
Refinaria de Mangalore e PetroChemicals Limited (MRPL.NS) DCF Avaliação |
Totalmente Editável: Adapte-Se Às Suas Necessidades No Excel Ou Planilhas
Design Profissional: Modelos Confiáveis E Padrão Da Indústria
Pré-Construídos Para Uso Rápido E Eficiente
Compatível com MAC/PC, totalmente desbloqueado
Não É Necessária Experiência; Fácil De Seguir
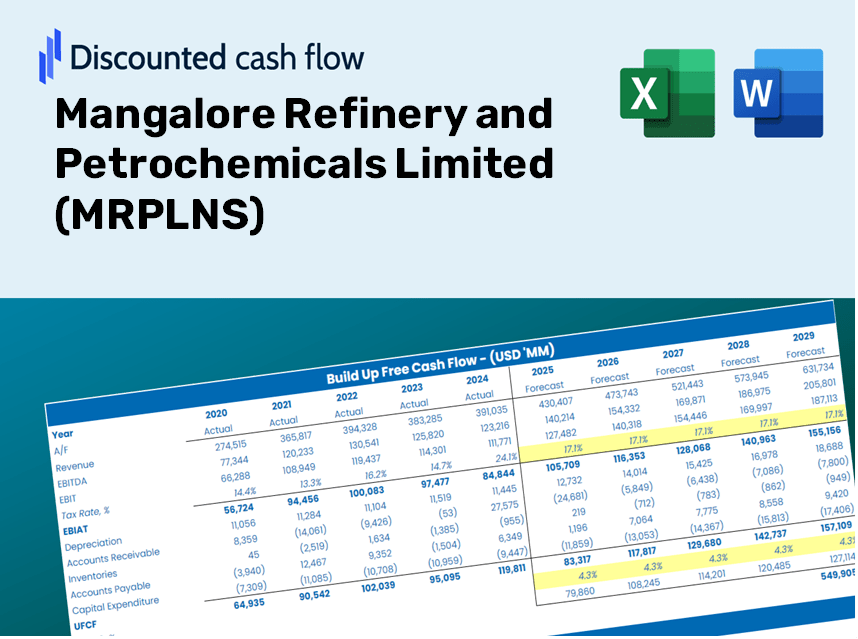
Mangalore Refinery and Petrochemicals Limited (MRPL.NS) Bundle
Simplifique a Refinaria de Mangalore e a Avaliação PetroChemicals Limited (MRPLNS) com esta calculadora DCF personalizável! Com a Real Mangalore Refinery e a PetroChemicals Limited (MRPLNS) e os insumos de previsão ajustável, você pode testar cenários e descobrir o Mangalore Refinery e o valor justo da PetroChemicals Limited (MRPLNS) em minutos.
What You Will Receive
- Authentic MRPL Data: Preloaded financial statistics – encompassing revenue to EBIT – based on actual and projected figures for Mangalore Refinery and Petrochemicals Limited (MRPLNS).
- Comprehensive Customization: Modify all key parameters (yellow cells) including WACC, growth %, and tax rates according to your needs.
- Real-Time Valuation Adjustments: Automatic recalculations to assess the effects of changes on the fair value of MRPL (MRPLNS).
- Flexible Excel Template: Designed for easy modifications, scenario analysis, and in-depth projections.
- Efficient and Precise: Eliminate the hassle of constructing models from the ground up while ensuring accuracy and adaptability.
Key Features
- Authentic MRPL Financials: Gain access to precise pre-loaded historical data and projected future figures.
- Adjustable Forecast Parameters: Modify the yellow-highlighted inputs such as WACC, growth rates, and profit margins.
- Real-Time Calculations: Automatic updates for DCF, Net Present Value (NPV), and cash flow assessments.
- Interactive Dashboard: User-friendly charts and summaries to help you visualize your valuation outcomes.
- Designed for All Users: A straightforward, intuitive layout tailored for investors, CFOs, and consultants alike.
How It Functions
- Download: Obtain the pre-prepared Excel file featuring Mangalore Refinery and Petrochemicals Limited's (MRPLNS) financial data.
- Customize: Modify forecasts, such as revenue growth, EBITDA %, and WACC.
- Auto-Update: The intrinsic value and NPV calculations refresh in real-time.
- Scenario Testing: Generate multiple projections and instantly compare results.
- Make Informed Decisions: Leverage the valuation findings to shape your investment approach.
Why Opt for This Calculator?
- Precision: Utilizes verified MRPLNS financial data for enhanced accuracy.
- Versatility: Crafted to allow users to easily adjust and experiment with inputs.
- Efficiency: Eliminate the need to create a DCF model from the ground up.
- Expert-Level: Designed with the insight and usability expected by finance professionals.
- Intuitive: Simple to navigate, making it accessible for users with varying levels of financial expertise.
Who Can Benefit from This Product?
- Finance Students: Master valuation methods and utilize them with actual market data related to Mangalore Refinery and Petrochemicals Limited (MRPLNS).
- Researchers: Integrate advanced industry models into your academic work or research projects.
- Investors: Validate your investment hypotheses and evaluate valuation results for Mangalore Refinery and Petrochemicals Limited (MRPLNS).
- Market Analysts: Optimize your analysis process with a ready-to-use, customizable DCF model tailored for the oil and gas sector.
- Entrepreneurs: Discover how major public companies like Mangalore Refinery and Petrochemicals Limited (MRPLNS) are assessed in the market.
Contents of the Template
- Preloaded MRPLNS Data: Historical and projected financial metrics, encompassing revenue, EBIT, and capital expenditures.
- DCF and WACC Models: Advanced sheets for computing intrinsic value and Weighted Average Cost of Capital.
- Editable Inputs: Yellow-highlighted fields for modifying revenue growth, tax rates, and discount rates.
- Financial Statements: Detailed annual and quarterly financial reports for extensive analysis.
- Key Ratios: Metrics on profitability, leverage, and efficiency for performance evaluation.
- Dashboard and Charts: Visual representations of valuation results and underlying assumptions.
Disclaimer
All information, articles, and product details provided on this website are for general informational and educational purposes only. We do not claim any ownership over, nor do we intend to infringe upon, any trademarks, copyrights, logos, brand names, or other intellectual property mentioned or depicted on this site. Such intellectual property remains the property of its respective owners, and any references here are made solely for identification or informational purposes, without implying any affiliation, endorsement, or partnership.
We make no representations or warranties, express or implied, regarding the accuracy, completeness, or suitability of any content or products presented. Nothing on this website should be construed as legal, tax, investment, financial, medical, or other professional advice. In addition, no part of this site—including articles or product references—constitutes a solicitation, recommendation, endorsement, advertisement, or offer to buy or sell any securities, franchises, or other financial instruments, particularly in jurisdictions where such activity would be unlawful.
All content is of a general nature and may not address the specific circumstances of any individual or entity. It is not a substitute for professional advice or services. Any actions you take based on the information provided here are strictly at your own risk. You accept full responsibility for any decisions or outcomes arising from your use of this website and agree to release us from any liability in connection with your use of, or reliance upon, the content or products found herein.