
|
Merus N.V. (mrus) DCF Avaliação |
Totalmente Editável: Adapte-Se Às Suas Necessidades No Excel Ou Planilhas
Design Profissional: Modelos Confiáveis E Padrão Da Indústria
Pré-Construídos Para Uso Rápido E Eficiente
Compatível com MAC/PC, totalmente desbloqueado
Não É Necessária Experiência; Fácil De Seguir
Merus N.V. (MRUS) Bundle
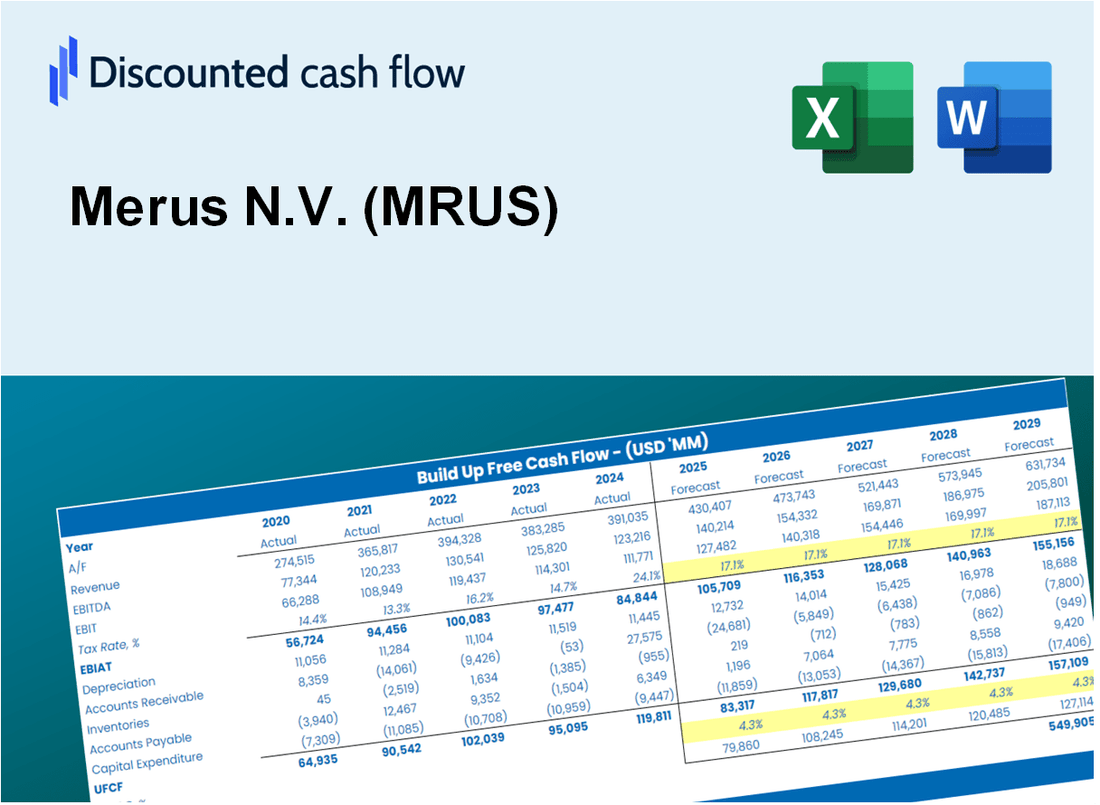
Avalie as perspectivas financeiras de Merus N.V. (mrus) com precisão especializada! Essa calculadora DCF (mrus) vem com dados financeiros pré-preenchidos e oferece a flexibilidade completa para modificar o crescimento da receita, o WACC, as margens e outras suposições críticas para se alinhar às suas projeções.
Discounted Cash Flow (DCF) - (USD MM)
| Year | AY1 2020 |
AY2 2021 |
AY3 2022 |
AY4 2023 |
AY5 2024 |
FY1 2025 |
FY2 2026 |
FY3 2027 |
FY4 2028 |
FY5 2029 |
|---|---|---|---|---|---|---|---|---|---|---|
| Revenue | 28.3 | 49.7 | 44.8 | 45.9 | 40.2 | 45.9 | 52.3 | 59.6 | 68.0 | 77.5 |
| Revenue Growth, % | 0 | 76.02 | -9.99 | 2.5 | -12.38 | 14.04 | 14.04 | 14.04 | 14.04 | 14.04 |
| EBITDA | -70.2 | -89.6 | -170.9 | -160.8 | -300.0 | -45.9 | -52.3 | -59.6 | -68.0 | -77.5 |
| EBITDA, % | -248.59 | -180.2 | -381.75 | -350.44 | -746.12 | -100 | -100 | -100 | -100 | -100 |
| Depreciation | 1.4 | 1.5 | 1.4 | 2.7 | 2.7 | 2.2 | 2.5 | 2.8 | 3.2 | 3.7 |
| Depreciation, % | 4.82 | 3.02 | 3.09 | 5.78 | 6.84 | 4.71 | 4.71 | 4.71 | 4.71 | 4.71 |
| EBIT | -71.6 | -91.1 | -172.3 | -163.5 | -302.7 | -45.9 | -52.3 | -59.6 | -68.0 | -77.5 |
| EBIT, % | -253.41 | -183.22 | -384.84 | -356.22 | -752.96 | -100 | -100 | -100 | -100 | -100 |
| Total Cash | 239.5 | 473.1 | 334.6 | 409.4 | 619.1 | 45.9 | 52.3 | 59.6 | 68.0 | 77.5 |
| Total Cash, percent | .0 | .0 | .0 | .0 | .0 | .0 | .0 | .0 | .0 | .0 |
| Account Receivables | 2.0 | 7.7 | 5.4 | 4.6 | 5.4 | 5.3 | 6.1 | 6.9 | 7.9 | 9.0 |
| Account Receivables, % | 7.14 | 15.47 | 12.1 | 10 | 13.5 | 11.64 | 11.64 | 11.64 | 11.64 | 11.64 |
| Inventories | .0 | .0 | .0 | .0 | .0 | .0 | .0 | .0 | .0 | .0 |
| Inventories, % | 0 | 0 | 0 | 0 | 0 | 0 | 0 | 0 | 0 | 0 |
| Accounts Payable | 3.6 | 15.3 | 11.3 | 5.3 | 4.8 | 8.5 | 9.6 | 11.0 | 12.5 | 14.3 |
| Accounts Payable, % | 12.75 | 30.68 | 25.32 | 11.56 | 11.94 | 18.45 | 18.45 | 18.45 | 18.45 | 18.45 |
| Capital Expenditure | -1.5 | -1.0 | -8.8 | -4.6 | -1.9 | -3.8 | -4.4 | -5.0 | -5.7 | -6.5 |
| Capital Expenditure, % | -5.25 | -2.02 | -19.67 | -10 | -4.78 | -8.34 | -8.34 | -8.34 | -8.34 | -8.34 |
| Tax Rate, % | -3.93 | -3.93 | -3.93 | -3.93 | -3.93 | -3.93 | -3.93 | -3.93 | -3.93 | -3.93 |
| EBITAT | -72.0 | -91.5 | -173.6 | -166.9 | -314.7 | -45.9 | -52.3 | -59.6 | -68.0 | -77.5 |
| Depreciation | ||||||||||
| Changes in Account Receivables | ||||||||||
| Changes in Inventories | ||||||||||
| Changes in Accounts Payable | ||||||||||
| Capital Expenditure | ||||||||||
| UFCF | -70.6 | -85.0 | -182.6 | -174.0 | -315.2 | -43.8 | -53.7 | -61.3 | -69.9 | -79.7 |
| WACC, % | 8.73 | 8.73 | 8.73 | 8.73 | 8.73 | 8.73 | 8.73 | 8.73 | 8.73 | 8.73 |
| PV UFCF | ||||||||||
| SUM PV UFCF | -235.8 | |||||||||
| Long Term Growth Rate, % | 2.00 | |||||||||
| Free cash flow (T + 1) | -81 | |||||||||
| Terminal Value | -1,207 | |||||||||
| Present Terminal Value | -794 | |||||||||
| Enterprise Value | -1,030 | |||||||||
| Net Debt | -327 | |||||||||
| Equity Value | -704 | |||||||||
| Diluted Shares Outstanding, MM | 64 | |||||||||
| Equity Value Per Share | -10.96 |
What You Will Get
- Real Merus N.V. Data: Preloaded financials – from revenue to EBIT – based on actual and projected figures.
- Full Customization: Adjust all critical parameters (yellow cells) like WACC, growth %, and tax rates.
- Instant Valuation Updates: Automatic recalculations to analyze the impact of changes on Merus N.V.’s fair value.
- Versatile Excel Template: Tailored for quick edits, scenario testing, and detailed projections.
- Time-Saving and Accurate: Skip building models from scratch while maintaining precision and flexibility.
Key Features
- 🔍 Real-Life MRUS Financials: Pre-filled historical and projected data for Merus N.V.
- ✏️ Fully Customizable Inputs: Adjust all critical parameters (yellow cells) like WACC, growth %, and tax rates.
- 📊 Professional DCF Valuation: Built-in formulas calculate Merus’s intrinsic value using the Discounted Cash Flow method.
- ⚡ Instant Results: Visualize Merus’s valuation instantly after making changes.
- Scenario Analysis: Test and compare outcomes for various financial assumptions side-by-side.
How It Works
- Download: Obtain the comprehensive Excel file containing Merus N.V. (MRUS) financial data.
- Customize: Modify forecasts such as revenue growth, EBITDA %, and WACC to fit your analysis.
- Update Automatically: Watch as intrinsic value and NPV calculations refresh in real-time.
- Test Scenarios: Generate various projections and evaluate results immediately.
- Make Decisions: Leverage the valuation findings to inform your investment strategy.
Why Choose This Calculator for Merus N.V. (MRUS)?
- Comprehensive Tool: Integrates DCF, WACC, and financial ratio analyses tailored for Merus N.V. (MRUS).
- Customizable Inputs: Modify yellow-highlighted cells to explore different financial scenarios.
- Detailed Insights: Automatically computes Merus N.V. (MRUS)’s intrinsic value and Net Present Value.
- Preloaded Data: Historical and projected data provide reliable starting points for analysis.
- Professional Quality: Perfect for financial analysts, investors, and business consultants focusing on Merus N.V. (MRUS).
Who Should Use This Product?
- Finance Students: Explore valuation methods and apply them to real-world data related to Merus N.V. (MRUS).
- Academics: Integrate advanced financial models into your studies or research focused on biotechnology.
- Investors: Evaluate your investment strategies and analyze the valuation metrics for Merus N.V. (MRUS).
- Analysts: Enhance your analysis process with a customizable DCF model tailored for biopharmaceutical companies.
- Biotech Entrepreneurs: Understand how publicly traded companies like Merus N.V. (MRUS) are valued in the market.
What the Template Contains
- Preloaded MRUS Data: Historical and projected financial data, including revenue, EBIT, and capital expenditures.
- DCF and WACC Models: Professional-grade sheets for calculating intrinsic value and Weighted Average Cost of Capital.
- Editable Inputs: Yellow-highlighted cells for adjusting revenue growth, tax rates, and discount rates.
- Financial Statements: Comprehensive annual and quarterly financials for deeper analysis.
- Key Ratios: Profitability, leverage, and efficiency ratios to evaluate performance.
- Dashboard and Charts: Visual summaries of valuation outcomes and assumptions.
Disclaimer
All information, articles, and product details provided on this website are for general informational and educational purposes only. We do not claim any ownership over, nor do we intend to infringe upon, any trademarks, copyrights, logos, brand names, or other intellectual property mentioned or depicted on this site. Such intellectual property remains the property of its respective owners, and any references here are made solely for identification or informational purposes, without implying any affiliation, endorsement, or partnership.
We make no representations or warranties, express or implied, regarding the accuracy, completeness, or suitability of any content or products presented. Nothing on this website should be construed as legal, tax, investment, financial, medical, or other professional advice. In addition, no part of this site—including articles or product references—constitutes a solicitation, recommendation, endorsement, advertisement, or offer to buy or sell any securities, franchises, or other financial instruments, particularly in jurisdictions where such activity would be unlawful.
All content is of a general nature and may not address the specific circumstances of any individual or entity. It is not a substitute for professional advice or services. Any actions you take based on the information provided here are strictly at your own risk. You accept full responsibility for any decisions or outcomes arising from your use of this website and agree to release us from any liability in connection with your use of, or reliance upon, the content or products found herein.