|
Avaliação ArcelorMittal S.A. (MT) DCF |
Totalmente Editável: Adapte-Se Às Suas Necessidades No Excel Ou Planilhas
Design Profissional: Modelos Confiáveis E Padrão Da Indústria
Pré-Construídos Para Uso Rápido E Eficiente
Compatível com MAC/PC, totalmente desbloqueado
Não É Necessária Experiência; Fácil De Seguir
ArcelorMittal S.A. (MT) Bundle
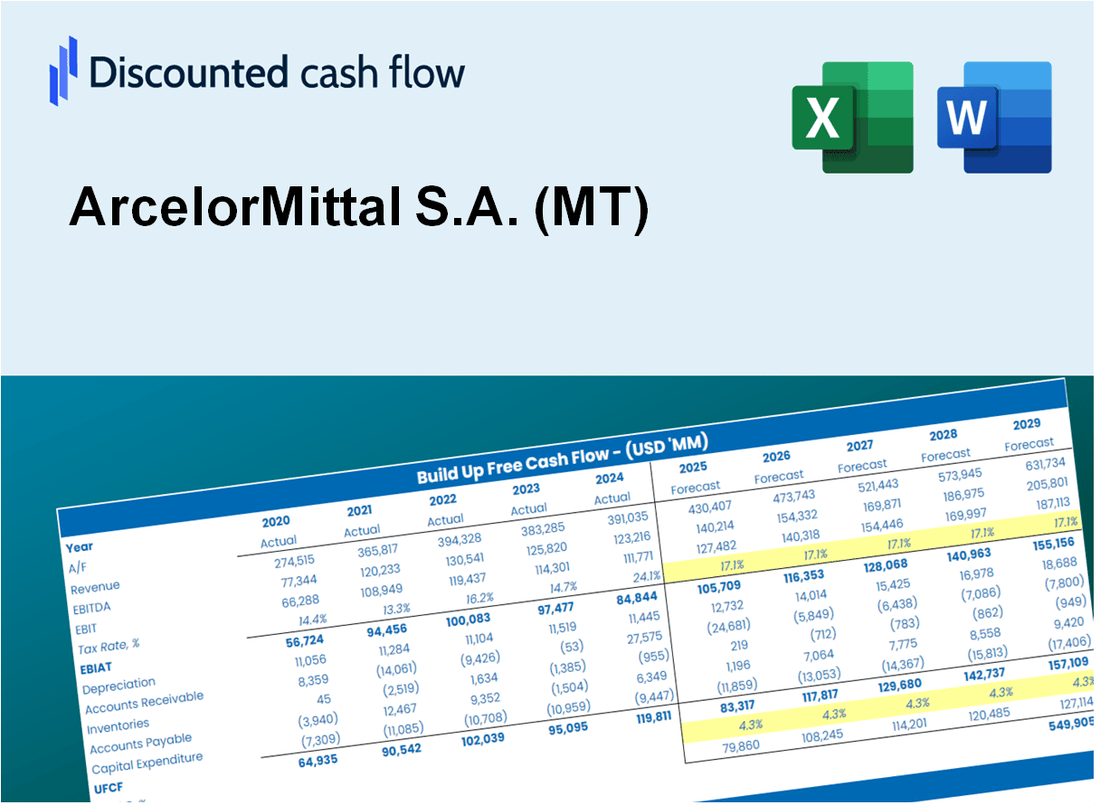
Descubra o verdadeiro potencial da ArcelorMittal S.A. (MT) com nossa calculadora DCF avançada! Ajuste as principais premissas, explore vários cenários e examine como diferentes fatores afetam a avaliação do arcelorMittal S.A. (MT) - tudo em um modelo conveniente do Excel.
Discounted Cash Flow (DCF) - (USD MM)
| Year | AY1 2020 |
AY2 2021 |
AY3 2022 |
AY4 2023 |
AY5 2024 |
FY1 2025 |
FY2 2026 |
FY3 2027 |
FY4 2028 |
FY5 2029 |
|---|---|---|---|---|---|---|---|---|---|---|
| Revenue | 53,270.0 | 76,571.0 | 79,844.0 | 68,275.0 | 62,441.0 | 66,340.7 | 70,483.9 | 74,885.8 | 79,562.7 | 84,531.7 |
| Revenue Growth, % | 0 | 43.74 | 4.27 | -14.49 | -8.54 | 6.25 | 6.25 | 6.25 | 6.25 | 6.25 |
| EBITDA | 5,258.0 | 19,148.0 | 14,234.0 | 5,579.0 | 6,057.0 | 9,364.2 | 9,949.0 | 10,570.3 | 11,230.5 | 11,931.9 |
| EBITDA, % | 9.87 | 25.01 | 17.83 | 8.17 | 9.7 | 14.12 | 14.12 | 14.12 | 14.12 | 14.12 |
| Depreciation | 2,960.0 | 2,523.0 | 2,580.0 | 2,440.0 | 2,632.0 | 2,636.6 | 2,801.3 | 2,976.2 | 3,162.1 | 3,359.6 |
| Depreciation, % | 5.56 | 3.29 | 3.23 | 3.57 | 4.22 | 3.97 | 3.97 | 3.97 | 3.97 | 3.97 |
| EBIT | 2,298.0 | 16,625.0 | 11,654.0 | 3,139.0 | 3,425.0 | 6,727.5 | 7,147.7 | 7,594.1 | 8,068.4 | 8,572.3 |
| EBIT, % | 4.31 | 21.71 | 14.6 | 4.6 | 5.49 | 10.14 | 10.14 | 10.14 | 10.14 | 10.14 |
| Total Cash | 5,963.0 | 4,215.0 | 9,300.0 | 7,686.0 | 6,400.0 | 6,614.6 | 7,027.7 | 7,466.6 | 7,932.9 | 8,428.4 |
| Total Cash, percent | .0 | .0 | .0 | .0 | .0 | .0 | .0 | .0 | .0 | .0 |
| Account Receivables | 4,190.0 | 7,084.0 | 6,214.0 | 5,196.0 | 5,656.0 | 5,515.3 | 5,859.8 | 6,225.8 | 6,614.6 | 7,027.7 |
| Account Receivables, % | 7.87 | 9.25 | 7.78 | 7.61 | 9.06 | 8.31 | 8.31 | 8.31 | 8.31 | 8.31 |
| Inventories | 12,328.0 | 19,858.0 | 20,087.0 | 18,759.0 | 16,501.0 | 17,001.3 | 18,063.1 | 19,191.2 | 20,389.8 | 21,663.2 |
| Inventories, % | 23.14 | 25.93 | 25.16 | 27.48 | 26.43 | 25.63 | 25.63 | 25.63 | 25.63 | 25.63 |
| Accounts Payable | 11,525.0 | 14,662.0 | 13,166.0 | 13,605.0 | 12,630.0 | 12,926.7 | 13,734.0 | 14,591.8 | 15,503.1 | 16,471.3 |
| Accounts Payable, % | 21.64 | 19.15 | 16.49 | 19.93 | 20.23 | 19.49 | 19.49 | 19.49 | 19.49 | 19.49 |
| Capital Expenditure | -2,439.0 | -3,008.0 | -3,468.0 | -4,613.0 | -4,405.0 | -3,537.5 | -3,758.4 | -3,993.1 | -4,242.5 | -4,507.5 |
| Capital Expenditure, % | -4.58 | -3.93 | -4.34 | -6.76 | -7.05 | -5.33 | -5.33 | -5.33 | -5.33 | -5.33 |
| Tax Rate, % | 54.07 | 54.07 | 54.07 | 54.07 | 54.07 | 54.07 | 54.07 | 54.07 | 54.07 | 54.07 |
| EBITAT | -1,548.2 | 13,794.4 | 9,631.8 | 2,289.5 | 1,573.3 | 3,827.9 | 4,066.9 | 4,320.9 | 4,590.8 | 4,877.5 |
| Depreciation | ||||||||||
| Changes in Account Receivables | ||||||||||
| Changes in Inventories | ||||||||||
| Changes in Accounts Payable | ||||||||||
| Capital Expenditure | ||||||||||
| UFCF | -6,020.2 | 6,022.4 | 7,888.8 | 2,901.5 | 623.3 | 2,864.0 | 2,510.9 | 2,667.7 | 2,834.3 | 3,011.3 |
| WACC, % | 8.53 | 9.52 | 9.51 | 9.4 | 9.08 | 9.21 | 9.21 | 9.21 | 9.21 | 9.21 |
| PV UFCF | ||||||||||
| SUM PV UFCF | 10,707.3 | |||||||||
| Long Term Growth Rate, % | 2.00 | |||||||||
| Free cash flow (T + 1) | 3,072 | |||||||||
| Terminal Value | 42,614 | |||||||||
| Present Terminal Value | 27,434 | |||||||||
| Enterprise Value | 38,141 | |||||||||
| Net Debt | 5,163 | |||||||||
| Equity Value | 32,978 | |||||||||
| Diluted Shares Outstanding, MM | 791 | |||||||||
| Equity Value Per Share | 41.69 |
What You Will Get
- Editable Forecast Inputs: Effortlessly adjust key assumptions (growth %, margins, WACC) to explore various scenarios.
- Real-World Data: ArcelorMittal’s financial data pre-loaded to facilitate your analysis.
- Automatic DCF Outputs: The template computes Net Present Value (NPV) and intrinsic value automatically.
- Customizable and Professional: A refined Excel model tailored to meet your valuation requirements.
- Built for Analysts and Investors: Perfect for evaluating projections, confirming strategies, and optimizing efficiency.
Key Features
- Comprehensive MT Data: Pre-populated with ArcelorMittal's historical performance metrics and future projections.
- Customizable Financial Inputs: Modify parameters such as revenue growth, profit margins, discount rates, taxation, and capital investments.
- Interactive Valuation Model: Automatically recalculates Net Present Value (NPV) and intrinsic value based on your adjustments.
- Scenario Analysis: Develop various forecasting scenarios to evaluate different valuation possibilities.
- Intuitive User Interface: Designed to be accessible and easy to navigate for both experts and newcomers.
How It Works
- Step 1: Download the Excel file for ArcelorMittal S.A. (MT).
- Step 2: Review ArcelorMittal’s pre-filled financial data and projections.
- Step 3: Adjust essential inputs such as production volume, cost of goods sold, and tax rates (highlighted cells).
- Step 4: Observe the DCF model refresh in real-time as you modify assumptions.
- Step 5: Evaluate the results and leverage the outputs for your investment strategies.
Why Choose This Calculator for ArcelorMittal S.A. (MT)?
- Comprehensive Tool: Offers DCF, WACC, and financial ratio analyses tailored for ArcelorMittal (MT).
- Customizable Inputs: Modify the highlighted cells to explore different financial scenarios for ArcelorMittal (MT).
- Detailed Insights: Automatically computes ArcelorMittal’s intrinsic value and Net Present Value.
- Preloaded Data: Includes historical and projected data to provide reliable starting points for analysis.
- Professional Quality: Perfect for financial analysts, investors, and business consultants focused on ArcelorMittal (MT).
Who Should Use This Product?
- Investors: Assess ArcelorMittal’s (MT) intrinsic value effectively before making investment choices.
- CFOs: Utilize a sophisticated DCF model for comprehensive financial analysis and reporting.
- Consultants: Easily customize the template for client valuation reports specific to ArcelorMittal (MT).
- Entrepreneurs: Acquire knowledge on financial modeling practices adopted by leading steel companies.
- Educators: Implement it as a resource to illustrate valuation techniques in the classroom.
What the Template Contains
- Pre-Filled Data: Contains ArcelorMittal’s historical financials and projections.
- Discounted Cash Flow Model: Customizable DCF valuation model with automatic calculations.
- Weighted Average Cost of Capital (WACC): A dedicated sheet for calculating WACC using tailored inputs.
- Key Financial Ratios: Assess ArcelorMittal’s profitability, efficiency, and leverage metrics.
- Customizable Inputs: Easily modify revenue growth, profit margins, and tax rates.
- Clear Dashboard: Visual representations and tables summarizing essential valuation outcomes.
Disclaimer
All information, articles, and product details provided on this website are for general informational and educational purposes only. We do not claim any ownership over, nor do we intend to infringe upon, any trademarks, copyrights, logos, brand names, or other intellectual property mentioned or depicted on this site. Such intellectual property remains the property of its respective owners, and any references here are made solely for identification or informational purposes, without implying any affiliation, endorsement, or partnership.
We make no representations or warranties, express or implied, regarding the accuracy, completeness, or suitability of any content or products presented. Nothing on this website should be construed as legal, tax, investment, financial, medical, or other professional advice. In addition, no part of this site—including articles or product references—constitutes a solicitation, recommendation, endorsement, advertisement, or offer to buy or sell any securities, franchises, or other financial instruments, particularly in jurisdictions where such activity would be unlawful.
All content is of a general nature and may not address the specific circumstances of any individual or entity. It is not a substitute for professional advice or services. Any actions you take based on the information provided here are strictly at your own risk. You accept full responsibility for any decisions or outcomes arising from your use of this website and agree to release us from any liability in connection with your use of, or reliance upon, the content or products found herein.