
|
Avaliação DCF da M&T Bank Corporation (MTB) |
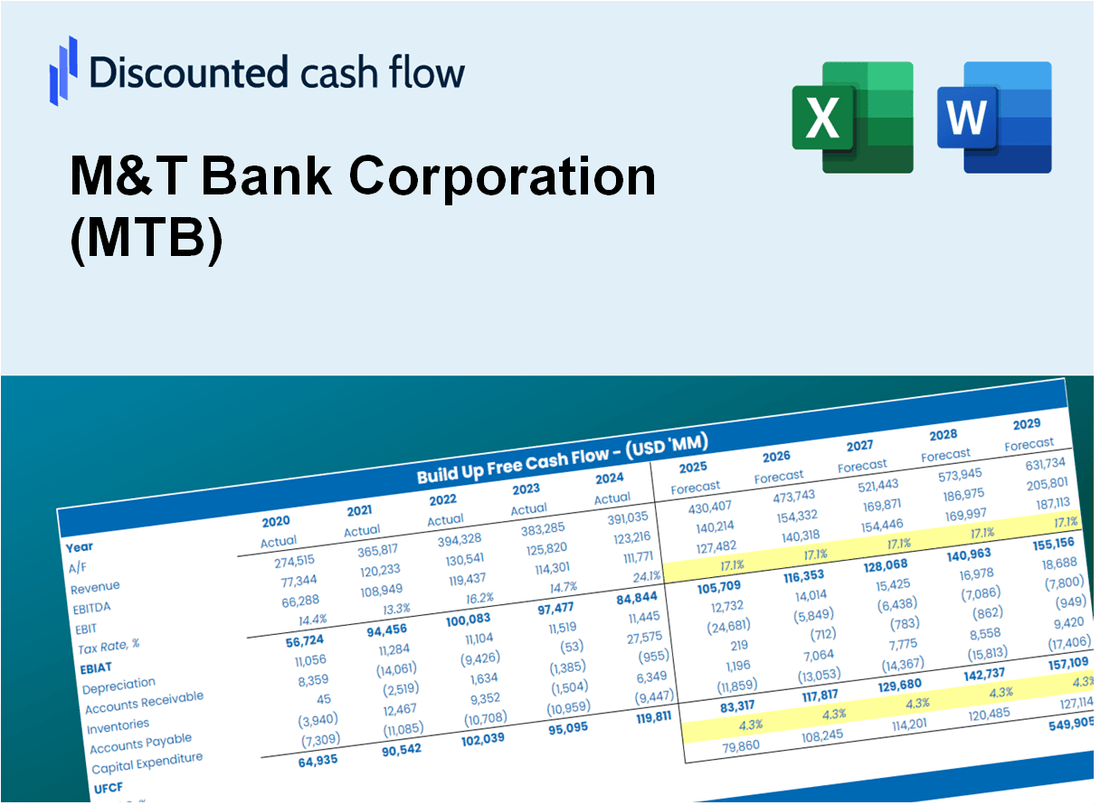
Totalmente Editável: Adapte-Se Às Suas Necessidades No Excel Ou Planilhas
Design Profissional: Modelos Confiáveis E Padrão Da Indústria
Pré-Construídos Para Uso Rápido E Eficiente
Compatível com MAC/PC, totalmente desbloqueado
Não É Necessária Experiência; Fácil De Seguir
M&T Bank Corporation (MTB) Bundle
Avalie as perspectivas financeiras da M&T Bank Corporation como um especialista! Esta calculadora MTB DCF fornece dados financeiros pré-preenchidos e a capacidade de personalizar o crescimento da receita, WACC, margens e outras suposições essenciais para se alinhar às suas previsões.
Discounted Cash Flow (DCF) - (USD MM)
| Year | AY1 2020 |
AY2 2021 |
AY3 2022 |
AY4 2023 |
AY5 2024 |
FY1 2025 |
FY2 2026 |
FY3 2027 |
FY4 2028 |
FY5 2029 |
|---|---|---|---|---|---|---|---|---|---|---|
| Revenue | 6,281.2 | 6,076.0 | 8,438.0 | 12,507.0 | 13,405.0 | 16,455.0 | 20,198.9 | 24,794.7 | 30,436.1 | 37,361.1 |
| Revenue Growth, % | 0 | -3.27 | 38.87 | 48.22 | 7.18 | 22.75 | 22.75 | 22.75 | 22.75 | 22.75 |
| EBITDA | 2,089.8 | 2,779.0 | 3,047.0 | 4,116.0 | 3,818.0 | 5,809.0 | 7,130.6 | 8,753.0 | 10,744.6 | 13,189.3 |
| EBITDA, % | 33.27 | 45.74 | 36.11 | 32.91 | 28.48 | 35.3 | 35.3 | 35.3 | 35.3 | 35.3 |
| Depreciation | 320.3 | 324.0 | 435.0 | 497.0 | 508.0 | 768.5 | 943.3 | 1,157.9 | 1,421.4 | 1,744.8 |
| Depreciation, % | 5.1 | 5.33 | 5.16 | 3.97 | 3.79 | 4.67 | 4.67 | 4.67 | 4.67 | 4.67 |
| EBIT | 1,769.5 | 2,455.0 | 2,612.0 | 3,619.0 | 3,310.0 | 5,040.5 | 6,187.3 | 7,595.1 | 9,323.2 | 11,444.5 |
| EBIT, % | 28.17 | 40.4 | 30.96 | 28.94 | 24.69 | 30.63 | 30.63 | 30.63 | 30.63 | 30.63 |
| Total Cash | 30,039.2 | 47,215.4 | 37,346.0 | 40,346.0 | 35,330.0 | 16,455.0 | 20,198.9 | 24,794.7 | 30,436.1 | 37,361.1 |
| Total Cash, percent | .0 | .0 | .0 | .0 | .0 | .0 | .0 | .0 | .0 | .0 |
| Account Receivables | 1,246.9 | 1,096.6 | 2,582.0 | 2,814.0 | .0 | 2,994.8 | 3,676.2 | 4,512.6 | 5,539.3 | 6,799.7 |
| Account Receivables, % | 19.85 | 18.05 | 30.6 | 22.5 | 0 | 18.2 | 18.2 | 18.2 | 18.2 | 18.2 |
| Inventories | .0 | .0 | .0 | .0 | .0 | .0 | .0 | .0 | .0 | .0 |
| Inventories, % | 0 | 0 | 0 | 0 | 0 | 0 | 0 | 0 | 0 | 0 |
| Accounts Payable | 2,166.4 | 2,127.9 | 4,377.0 | 4,516.0 | .0 | 5,183.1 | 6,362.4 | 7,810.0 | 9,586.9 | 11,768.2 |
| Accounts Payable, % | 34.49 | 35.02 | 51.87 | 36.11 | 0 | 31.5 | 31.5 | 31.5 | 31.5 | 31.5 |
| Capital Expenditure | -172.3 | -149.0 | -214.0 | -256.0 | -216.0 | -374.8 | -460.1 | -564.8 | -693.3 | -851.1 |
| Capital Expenditure, % | -2.74 | -2.45 | -2.54 | -2.05 | -1.61 | -2.28 | -2.28 | -2.28 | -2.28 | -2.28 |
| Tax Rate, % | 21.81 | 21.81 | 21.81 | 21.81 | 21.81 | 21.81 | 21.81 | 21.81 | 21.81 | 21.81 |
| EBITAT | 1,353.2 | 1,859.0 | 1,992.0 | 2,741.0 | 2,588.0 | 3,854.8 | 4,731.9 | 5,808.5 | 7,130.1 | 8,752.3 |
| Depreciation | ||||||||||
| Changes in Account Receivables | ||||||||||
| Changes in Inventories | ||||||||||
| Changes in Accounts Payable | ||||||||||
| Capital Expenditure | ||||||||||
| UFCF | 2,420.7 | 2,145.8 | 2,976.7 | 2,889.0 | 1,178.0 | 6,436.7 | 5,712.9 | 7,012.8 | 8,608.4 | 10,567.0 |
| WACC, % | 11.7 | 11.63 | 11.68 | 11.63 | 11.86 | 11.7 | 11.7 | 11.7 | 11.7 | 11.7 |
| PV UFCF | ||||||||||
| SUM PV UFCF | 26,980.7 | |||||||||
| Long Term Growth Rate, % | 2.00 | |||||||||
| Free cash flow (T + 1) | 10,778 | |||||||||
| Terminal Value | 111,129 | |||||||||
| Present Terminal Value | 63,912 | |||||||||
| Enterprise Value | 90,893 | |||||||||
| Net Debt | -7,117 | |||||||||
| Equity Value | 98,010 | |||||||||
| Diluted Shares Outstanding, MM | 167 | |||||||||
| Equity Value Per Share | 585.77 |
What You Will Receive
- Customizable Excel Template: A fully adjustable Excel-based DCF Calculator featuring pre-filled real MTB financials.
- Authentic Data: Historical data and forward-looking estimates (highlighted in the yellow cells).
- Forecast Adaptability: Modify forecast assumptions such as revenue growth, EBITDA %, and WACC.
- Instant Calculations: Quickly observe how your inputs affect M&T Bank's valuation.
- Professional Resource: Designed for investors, CFOs, consultants, and financial analysts.
- User-Centric Layout: Organized for clarity and ease of use, complete with step-by-step guidance.
Key Features
- 🔍 Real-Life MTB Financials: Pre-filled historical and projected data for M&T Bank Corporation (MTB).
- ✏️ Fully Customizable Inputs: Adjust all critical parameters (yellow cells) like WACC, growth %, and tax rates.
- 📊 Professional DCF Valuation: Built-in formulas calculate M&T Bank's intrinsic value using the Discounted Cash Flow method.
- ⚡ Instant Results: Visualize M&T Bank's valuation instantly after making changes.
- Scenario Analysis: Test and compare outcomes for various financial assumptions side-by-side.
How It Works
- 1. Access the Template: Download and open the Excel file featuring M&T Bank Corporation’s (MTB) preloaded data.
- 2. Modify Assumptions: Adjust key inputs such as growth rates, WACC, and capital expenditures.
- 3. View Results in Real-Time: The DCF model automatically computes intrinsic value and NPV.
- 4. Explore Scenarios: Evaluate various forecasts to assess different valuation results.
- 5. Utilize with Assurance: Deliver professional valuation insights to enhance your decision-making.
Why Choose This Calculator for M&T Bank Corporation (MTB)?
- All-in-One Solution: Features DCF, WACC, and financial ratio analyses tailored for M&T Bank.
- Flexible Inputs: Modify yellow-highlighted cells to explore different financial scenarios.
- In-Depth Analysis: Automatically computes M&T Bank’s intrinsic value and Net Present Value.
- Preloaded Information: Historical and projected data provide a solid foundation for analysis.
- Expert-Level Tool: Perfect for financial analysts, investors, and business advisors focused on M&T Bank.
Who Should Use M&T Bank Corporation (MTB) Services?
- Investors: Gain insights and make informed decisions with M&T's comprehensive financial solutions.
- Financial Analysts: Streamline your analysis with M&T's robust data and analytics tools tailored for your needs.
- Consultants: Efficiently customize M&T's resources for client presentations or strategic reports.
- Finance Enthusiasts: Enhance your knowledge of banking services and market trends with M&T's expert insights.
- Educators and Students: Utilize M&T's resources as a practical guide in finance and banking coursework.
What the Template Contains
- Historical Data: Includes M&T Bank Corporation’s past financials and baseline forecasts.
- DCF and Levered DCF Models: Detailed templates to calculate M&T Bank Corporation’s intrinsic value.
- WACC Sheet: Pre-built calculations for Weighted Average Cost of Capital.
- Editable Inputs: Modify key drivers like growth rates, EBITDA %, and CAPEX assumptions.
- Quarterly and Annual Statements: A complete breakdown of M&T Bank Corporation’s financials.
- Interactive Dashboard: Visualize valuation results and projections dynamically.
Disclaimer
All information, articles, and product details provided on this website are for general informational and educational purposes only. We do not claim any ownership over, nor do we intend to infringe upon, any trademarks, copyrights, logos, brand names, or other intellectual property mentioned or depicted on this site. Such intellectual property remains the property of its respective owners, and any references here are made solely for identification or informational purposes, without implying any affiliation, endorsement, or partnership.
We make no representations or warranties, express or implied, regarding the accuracy, completeness, or suitability of any content or products presented. Nothing on this website should be construed as legal, tax, investment, financial, medical, or other professional advice. In addition, no part of this site—including articles or product references—constitutes a solicitation, recommendation, endorsement, advertisement, or offer to buy or sell any securities, franchises, or other financial instruments, particularly in jurisdictions where such activity would be unlawful.
All content is of a general nature and may not address the specific circumstances of any individual or entity. It is not a substitute for professional advice or services. Any actions you take based on the information provided here are strictly at your own risk. You accept full responsibility for any decisions or outcomes arising from your use of this website and agree to release us from any liability in connection with your use of, or reliance upon, the content or products found herein.