
|
Avaliação DCF da MEXCO Energy Corporation (MXC) |
Totalmente Editável: Adapte-Se Às Suas Necessidades No Excel Ou Planilhas
Design Profissional: Modelos Confiáveis E Padrão Da Indústria
Pré-Construídos Para Uso Rápido E Eficiente
Compatível com MAC/PC, totalmente desbloqueado
Não É Necessária Experiência; Fácil De Seguir
Mexco Energy Corporation (MXC) Bundle
Revele o verdadeiro valor da Mexco Energy Corporation (MXC) com nossa calculadora DCF de nível profissional! Ajuste as principais suposições, explore vários cenários e avalie como as mudanças afetam a avaliação da MEXCO Energy Corporation (MXC) - tudo dentro de um único modelo do Excel.
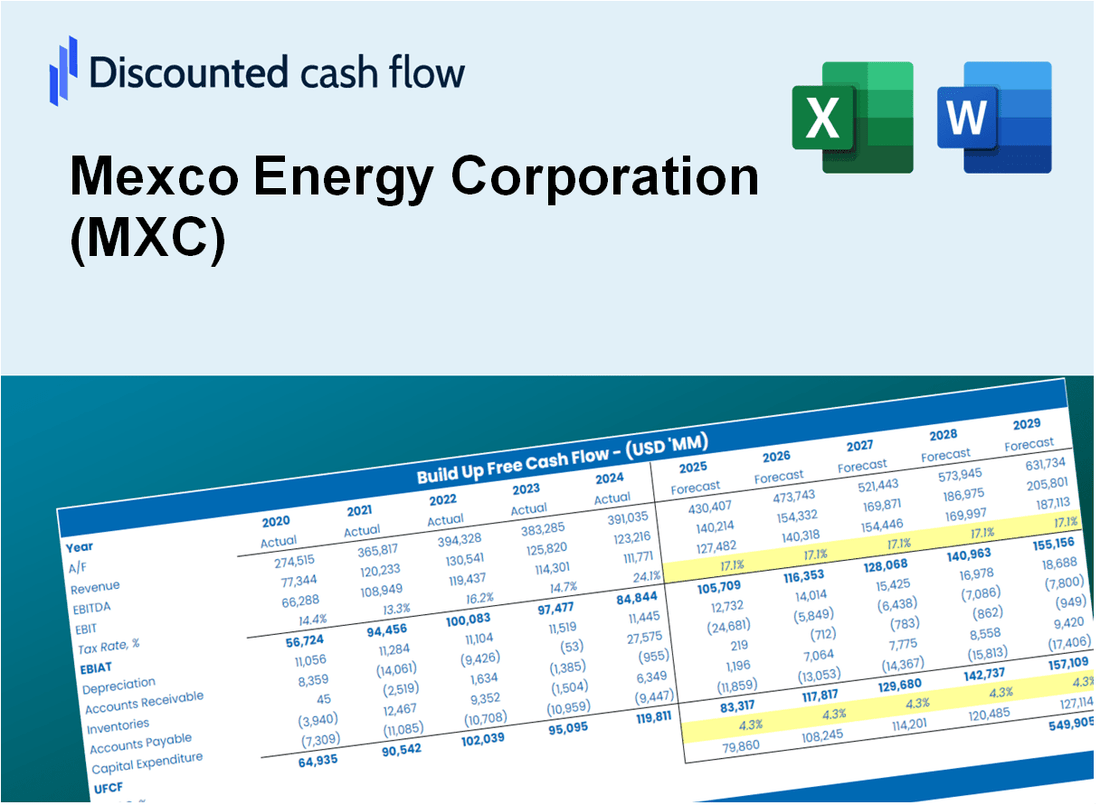
Discounted Cash Flow (DCF) - (USD MM)
| Year | AY1 2020 |
AY2 2021 |
AY3 2022 |
AY4 2023 |
AY5 2024 |
FY1 2025 |
FY2 2026 |
FY3 2027 |
FY4 2028 |
FY5 2029 |
|---|---|---|---|---|---|---|---|---|---|---|
| Revenue | 2.8 | 6.6 | 9.6 | 6.6 | 7.4 | 9.7 | 12.7 | 16.7 | 21.9 | 28.8 |
| Revenue Growth, % | 0 | 135.36 | 45.08 | -30.89 | 11.4 | 31.4 | 31.4 | 31.4 | 31.4 | 31.4 |
| EBITDA | 1.1 | 4.3 | 6.7 | 4.0 | 4.5 | 5.8 | 7.6 | 9.9 | 13.1 | 17.2 |
| EBITDA, % | 40.87 | 65.72 | 70.04 | 60.11 | 60.82 | 59.51 | 59.51 | 59.51 | 59.51 | 59.51 |
| Depreciation | .9 | 1.3 | 1.9 | 2.0 | 2.5 | 2.6 | 3.5 | 4.6 | 6.0 | 7.9 |
| Depreciation, % | 33.4 | 20.42 | 19.4 | 30.27 | 33.33 | 27.37 | 27.37 | 27.37 | 27.37 | 27.37 |
| EBIT | .2 | 3.0 | 4.8 | 2.0 | 2.0 | 3.1 | 4.1 | 5.4 | 7.1 | 9.3 |
| EBIT, % | 7.47 | 45.29 | 50.65 | 29.84 | 27.49 | 32.15 | 32.15 | 32.15 | 32.15 | 32.15 |
| Total Cash | .1 | 1.4 | 2.2 | 2.5 | 1.8 | 2.1 | 2.7 | 3.6 | 4.7 | 6.2 |
| Total Cash, percent | .0 | .0 | .0 | .0 | .0 | .0 | .0 | .0 | .0 | .0 |
| Account Receivables | .7 | 1.3 | 1.4 | 1.0 | 1.2 | 1.7 | 2.3 | 3.0 | 3.9 | 5.1 |
| Account Receivables, % | 23.29 | 19.89 | 14.37 | 15.31 | 16.06 | 17.78 | 17.78 | 17.78 | 17.78 | 17.78 |
| Inventories | .0 | .0 | .0 | .0 | .0 | .0 | .0 | .0 | .0 | .0 |
| Inventories, % | 0 | 0 | 0 | 0 | 0 | 0 | 0 | 0 | 0 | 0 |
| Accounts Payable | .1 | .2 | .2 | .2 | .3 | .3 | .4 | .5 | .7 | .9 |
| Accounts Payable, % | 3.63 | 2.95 | 1.9 | 2.9 | 4.18 | 3.11 | 3.11 | 3.11 | 3.11 | 3.11 |
| Capital Expenditure | -1.6 | -1.9 | -5.3 | -3.3 | -3.4 | -4.6 | -6.1 | -8.0 | -10.5 | -13.7 |
| Capital Expenditure, % | -56.99 | -28.67 | -55.58 | -50.71 | -46.43 | -47.68 | -47.68 | -47.68 | -47.68 | -47.68 |
| Tax Rate, % | 15.09 | 15.09 | 15.09 | 15.09 | 15.09 | 15.09 | 15.09 | 15.09 | 15.09 | 15.09 |
| EBITAT | .2 | 2.9 | 4.7 | 1.3 | 1.7 | 2.8 | 3.6 | 4.8 | 6.3 | 8.3 |
| Depreciation | ||||||||||
| Changes in Account Receivables | ||||||||||
| Changes in Inventories | ||||||||||
| Changes in Accounts Payable | ||||||||||
| Capital Expenditure | ||||||||||
| UFCF | -1.0 | 1.8 | 1.1 | .4 | .7 | .3 | .6 | .8 | 1.1 | 1.4 |
| WACC, % | 5.26 | 5.26 | 5.26 | 5.25 | 5.25 | 5.25 | 5.25 | 5.25 | 5.25 | 5.25 |
| PV UFCF | ||||||||||
| SUM PV UFCF | 3.5 | |||||||||
| Long Term Growth Rate, % | 0.50 | |||||||||
| Free cash flow (T + 1) | 1 | |||||||||
| Terminal Value | 30 | |||||||||
| Present Terminal Value | 23 | |||||||||
| Enterprise Value | 27 | |||||||||
| Net Debt | -2 | |||||||||
| Equity Value | 28 | |||||||||
| Diluted Shares Outstanding, MM | 2 | |||||||||
| Equity Value Per Share | 13.37 |
What You Will Receive
- Pre-Filled Financial Model: Mexco Energy Corporation's (MXC) actual data allows for accurate DCF valuation.
- Comprehensive Forecast Control: Modify revenue growth, profit margins, WACC, and other essential factors.
- Real-Time Calculations: Automatic updates provide immediate feedback as you adjust inputs.
- Professional-Grade Template: A polished Excel file crafted for high-quality valuation analysis.
- Flexible and Reusable: Designed for adaptability, enabling repeated applications for in-depth forecasts.
Key Features
- Comprehensive Historical Data: Access Mexco Energy Corporation’s (MXC) past financial statements and detailed forecasts.
- Customizable Parameters: Adjust WACC, tax rates, revenue growth, and EBITDA margins to fit your analysis.
- Real-Time Valuation: Instantly view the recalculated intrinsic value of Mexco Energy Corporation (MXC).
- Intuitive Visualizations: Engaging dashboard charts illustrate valuation outcomes and essential metrics.
- Designed for Precision: A robust tool tailored for analysts, investors, and finance professionals.
How It Works
- Step 1: Download the Excel file.
- Step 2: Review pre-entered Mexco Energy Corporation (MXC) data (historical and projected).
- Step 3: Adjust key assumptions (yellow cells) based on your analysis.
- Step 4: View automatic recalculations for Mexco Energy Corporation's intrinsic value.
- Step 5: Use the outputs for investment decisions or reporting.
Why Choose This Calculator for Mexco Energy Corporation (MXC)?
- Precision: Utilizes real Mexco financial data for reliable results.
- Adaptability: Built for users to easily adjust and experiment with inputs.
- Efficiency: Eliminate the need to create a DCF model from the ground up.
- Expert-Level: Crafted with the accuracy and functionality expected by CFOs.
- Intuitive: Simple interface suitable for users with varying levels of financial expertise.
Who Should Use This Product?
- Investors: Accurately assess Mexco Energy Corporation’s (MXC) fair value before making investment choices.
- CFOs: Utilize a professional-grade DCF model for financial reporting and analysis specific to Mexco Energy Corporation (MXC).
- Consultants: Quickly customize the template for valuation reports tailored to Mexco Energy Corporation (MXC) clients.
- Entrepreneurs: Acquire insights into financial modeling practices employed by leading energy firms, including Mexco Energy Corporation (MXC).
- Educators: Implement it as a teaching resource to illustrate valuation techniques relevant to the energy sector, including Mexco Energy Corporation (MXC).
What the Template Contains
- Comprehensive DCF Model: Editable template featuring detailed valuation calculations.
- Real-World Data: Mexco Energy Corporation’s (MXC) historical and projected financials preloaded for analysis.
- Customizable Parameters: Adjust WACC, growth rates, and tax assumptions to explore various scenarios.
- Financial Statements: Complete annual and quarterly breakdowns for enhanced insights.
- Key Ratios: Integrated analysis for profitability, efficiency, and leverage metrics.
- Dashboard with Visual Outputs: Charts and tables providing clear, actionable results.
Disclaimer
All information, articles, and product details provided on this website are for general informational and educational purposes only. We do not claim any ownership over, nor do we intend to infringe upon, any trademarks, copyrights, logos, brand names, or other intellectual property mentioned or depicted on this site. Such intellectual property remains the property of its respective owners, and any references here are made solely for identification or informational purposes, without implying any affiliation, endorsement, or partnership.
We make no representations or warranties, express or implied, regarding the accuracy, completeness, or suitability of any content or products presented. Nothing on this website should be construed as legal, tax, investment, financial, medical, or other professional advice. In addition, no part of this site—including articles or product references—constitutes a solicitation, recommendation, endorsement, advertisement, or offer to buy or sell any securities, franchises, or other financial instruments, particularly in jurisdictions where such activity would be unlawful.
All content is of a general nature and may not address the specific circumstances of any individual or entity. It is not a substitute for professional advice or services. Any actions you take based on the information provided here are strictly at your own risk. You accept full responsibility for any decisions or outcomes arising from your use of this website and agree to release us from any liability in connection with your use of, or reliance upon, the content or products found herein.