
|
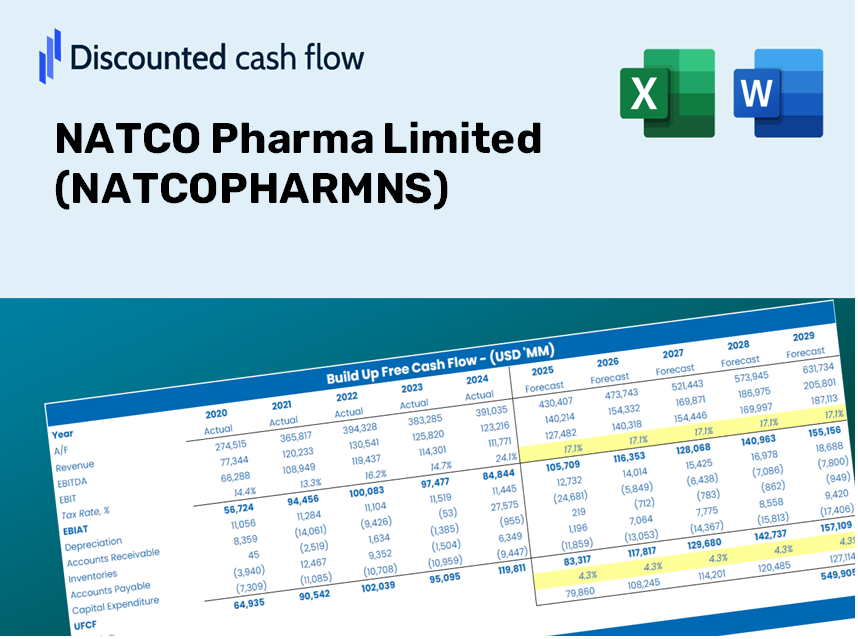
NATCO Pharma Limited (Natcopharm.NS) Avaliação DCF |
Totalmente Editável: Adapte-Se Às Suas Necessidades No Excel Ou Planilhas
Design Profissional: Modelos Confiáveis E Padrão Da Indústria
Pré-Construídos Para Uso Rápido E Eficiente
Compatível com MAC/PC, totalmente desbloqueado
Não É Necessária Experiência; Fácil De Seguir
NATCO Pharma Limited (NATCOPHARM.NS) Bundle
Simplifique sua análise e melhore a precisão com a calculadora DCF (Natcopharmns)! Equipado com dados genuínos da NATCO Pharma Limited e suposições personalizáveis, essa ferramenta permite prever, analisar e avaliar a NATCO Pharma como um investidor experiente.
Discounted Cash Flow (DCF) - (USD MM)
| Year | AY1 2021 |
AY2 2022 |
AY3 2023 |
AY4 2024 |
AY5 2025 |
FY1 2026 |
FY2 2027 |
FY3 2028 |
FY4 2029 |
FY5 2030 |
|---|---|---|---|---|---|---|---|---|---|---|
| Revenue | 20,561.0 | 19,049.0 | 27,071.0 | 40,020.0 | 44,295.0 | 54,624.0 | 67,361.5 | 83,069.3 | 102,439.8 | 126,327.4 |
| Revenue Growth, % | 0 | -7.35 | 42.11 | 47.83 | 10.68 | 23.32 | 23.32 | 23.32 | 23.32 | 23.32 |
| EBITDA | 6,066.0 | 3,625.0 | 10,402.0 | 18,795.0 | 25,505.0 | 20,921.1 | 25,799.6 | 31,815.7 | 39,234.7 | 48,383.7 |
| EBITDA, % | 29.5 | 19.03 | 38.42 | 46.96 | 57.58 | 38.3 | 38.3 | 38.3 | 38.3 | 38.3 |
| Depreciation | 1,133.0 | 1,426.0 | 1,638.0 | 1,868.0 | 2,352.0 | 3,170.9 | 3,910.3 | 4,822.1 | 5,946.6 | 7,333.2 |
| Depreciation, % | 5.51 | 7.49 | 6.05 | 4.67 | 5.31 | 5.8 | 5.8 | 5.8 | 5.8 | 5.8 |
| EBIT | 4,933.0 | 2,199.0 | 8,764.0 | 16,927.0 | 23,153.0 | 17,750.2 | 21,889.3 | 26,993.6 | 33,288.1 | 41,050.4 |
| EBIT, % | 23.99 | 11.54 | 32.37 | 42.3 | 52.27 | 32.5 | 32.5 | 32.5 | 32.5 | 32.5 |
| Total Cash | 8,177.0 | 7,599.0 | 11,248.0 | 17,781.0 | 24,968.0 | 24,254.0 | 29,909.7 | 36,884.3 | 45,485.2 | 56,091.7 |
| Total Cash, percent | .0 | .0 | .0 | .0 | .0 | .0 | .0 | .0 | .0 | .0 |
| Account Receivables | 4,981.0 | 6,855.0 | 9,014.0 | 12,685.0 | 12,560.0 | 16,776.2 | 20,688.2 | 25,512.4 | 31,461.6 | 38,798.0 |
| Account Receivables, % | 24.23 | 35.99 | 33.3 | 31.7 | 28.36 | 30.71 | 30.71 | 30.71 | 30.71 | 30.71 |
| Inventories | 9,104.0 | 8,620.0 | 8,089.0 | 7,917.0 | 7,658.0 | 17,095.3 | 21,081.7 | 25,997.6 | 32,059.9 | 39,535.8 |
| Inventories, % | 44.28 | 45.25 | 29.88 | 19.78 | 17.29 | 31.3 | 31.3 | 31.3 | 31.3 | 31.3 |
| Accounts Payable | 1,462.0 | 1,618.0 | 2,638.0 | 2,355.0 | 2,749.0 | 4,090.2 | 5,044.0 | 6,220.2 | 7,670.7 | 9,459.4 |
| Accounts Payable, % | 7.11 | 8.49 | 9.74 | 5.88 | 6.21 | 7.49 | 7.49 | 7.49 | 7.49 | 7.49 |
| Capital Expenditure | -2,546.0 | -2,427.0 | -2,056.0 | -3,394.0 | -4,011.0 | -5,490.2 | -6,770.4 | -8,349.2 | -10,296.1 | -12,697.0 |
| Capital Expenditure, % | -12.38 | -12.74 | -7.59 | -8.48 | -9.06 | -10.05 | -10.05 | -10.05 | -10.05 | -10.05 |
| Tax Rate, % | 17.72 | 17.72 | 17.72 | 17.72 | 17.72 | 17.72 | 17.72 | 17.72 | 17.72 | 17.72 |
| EBITAT | 3,752.5 | 1,848.8 | 7,273.3 | 14,042.3 | 19,050.7 | 14,497.5 | 17,878.1 | 22,047.0 | 27,188.1 | 33,528.0 |
| Depreciation | ||||||||||
| Changes in Account Receivables | ||||||||||
| Changes in Inventories | ||||||||||
| Changes in Accounts Payable | ||||||||||
| Capital Expenditure | ||||||||||
| UFCF | -10,283.5 | -386.2 | 6,247.3 | 8,734.3 | 18,169.7 | -134.1 | 8,073.4 | 9,956.0 | 12,277.6 | 15,140.6 |
| WACC, % | 4.7 | 4.71 | 4.71 | 4.71 | 4.71 | 4.71 | 4.71 | 4.71 | 4.71 | 4.71 |
| PV UFCF | ||||||||||
| SUM PV UFCF | 38,152.1 | |||||||||
| Long Term Growth Rate, % | 3.50 | |||||||||
| Free cash flow (T + 1) | 15,671 | |||||||||
| Terminal Value | 1,297,647 | |||||||||
| Present Terminal Value | 1,031,016 | |||||||||
| Enterprise Value | 1,069,168 | |||||||||
| Net Debt | -18,966 | |||||||||
| Equity Value | 1,088,134 | |||||||||
| Diluted Shares Outstanding, MM | 179 | |||||||||
| Equity Value Per Share | 6,074.96 |
Benefits You'll Receive
- Genuine NATCOPHARMNS Financial Data: Pre-populated with NATCO Pharma's historical and forecasted figures for accurate analysis.
- Completely Customizable Template: Easily adjust critical inputs such as revenue growth, WACC, and EBITDA percentage.
- Instant Calculations: Observe real-time updates of NATCO Pharma's intrinsic value as you make modifications.
- Professional Valuation Tool: Tailored for investors, analysts, and consultants in pursuit of precise DCF outcomes.
- User-Friendly Layout: Intuitive design and straightforward instructions suitable for all skill levels.
Key Features
- Genuine NATCO Financials: Access reliable pre-loaded historical data and future forecasts for NATCO Pharma Limited.
- Customizable Forecast Inputs: Modify the yellow-highlighted fields, including WACC, growth rates, and profit margins.
- Real-Time Calculations: Automatic refreshing of DCF, Net Present Value (NPV), and cash flow assessments.
- User-Friendly Dashboard: Intuitive charts and summaries to clearly present your valuation outcomes.
- Suitable for All Levels: Designed for both professionals and novices, ideal for investors, CFOs, and consultants.
How It Functions
- Download: Obtain the pre-prepared Excel file featuring NATCO Pharma Limited’s financial data.
- Customize: Modify forecasts, including revenue growth, EBITDA %, and WACC tailored to your analysis.
- Update Automatically: The intrinsic value and NPV calculations refresh in real time.
- Test Scenarios: Develop various projections and instantly compare the results.
- Make Decisions: Utilize the valuation findings to inform your investment approach.
Why Opt for This Calculator?
- Designed for Experts: A sophisticated tool favored by financial analysts, CFOs, and consultants.
- Accurate Financial Data: NATCO Pharma's historical and projected financials are preloaded for precise calculations.
- Versatile Scenario Analysis: Effortlessly test various forecasts and assumptions.
- Transparent Results: Automatically computes intrinsic value, NPV, and essential metrics.
- User-Friendly: Comprehensive step-by-step guidance makes the process straightforward.
Who Should Use NATCO Pharma Limited (NATCOPHARMNS)?
- Individual Investors: Gain insights to make informed decisions about buying or selling shares in NATCO Pharma.
- Financial Analysts: Enhance valuation methodologies with tailored financial models specific to NATCO Pharma.
- Consultants: Provide clients with accurate and timely valuation assessments of NATCO Pharma's performance.
- Business Owners: Learn from the valuation practices of major players like NATCO Pharma to inform your strategic planning.
- Finance Students: Explore valuation principles through real-world data and examples related to NATCO Pharma.
Contents of the Template
- Preloaded NATCOPHARMNS Data: Historical and projected financial information, including revenue, EBIT, and capital expenditures.
- DCF and WACC Models: Professional-grade spreadsheets for assessing intrinsic value and calculating the Weighted Average Cost of Capital.
- Editable Inputs: Yellow-highlighted cells for modifying revenue growth rates, tax rates, and discount rates.
- Financial Statements: Detailed annual and quarterly financial reports for thorough analysis.
- Key Ratios: Metrics on profitability, leverage, and efficiency to assess performance.
- Dashboard and Charts: Visual representations of valuation results and underlying assumptions.
Disclaimer
All information, articles, and product details provided on this website are for general informational and educational purposes only. We do not claim any ownership over, nor do we intend to infringe upon, any trademarks, copyrights, logos, brand names, or other intellectual property mentioned or depicted on this site. Such intellectual property remains the property of its respective owners, and any references here are made solely for identification or informational purposes, without implying any affiliation, endorsement, or partnership.
We make no representations or warranties, express or implied, regarding the accuracy, completeness, or suitability of any content or products presented. Nothing on this website should be construed as legal, tax, investment, financial, medical, or other professional advice. In addition, no part of this site—including articles or product references—constitutes a solicitation, recommendation, endorsement, advertisement, or offer to buy or sell any securities, franchises, or other financial instruments, particularly in jurisdictions where such activity would be unlawful.
All content is of a general nature and may not address the specific circumstances of any individual or entity. It is not a substitute for professional advice or services. Any actions you take based on the information provided here are strictly at your own risk. You accept full responsibility for any decisions or outcomes arising from your use of this website and agree to release us from any liability in connection with your use of, or reliance upon, the content or products found herein.