
|
Nava Limited (Nava.NS) Avaliação DCF |
Totalmente Editável: Adapte-Se Às Suas Necessidades No Excel Ou Planilhas
Design Profissional: Modelos Confiáveis E Padrão Da Indústria
Pré-Construídos Para Uso Rápido E Eficiente
Compatível com MAC/PC, totalmente desbloqueado
Não É Necessária Experiência; Fácil De Seguir
Nava Limited (NAVA.NS) Bundle
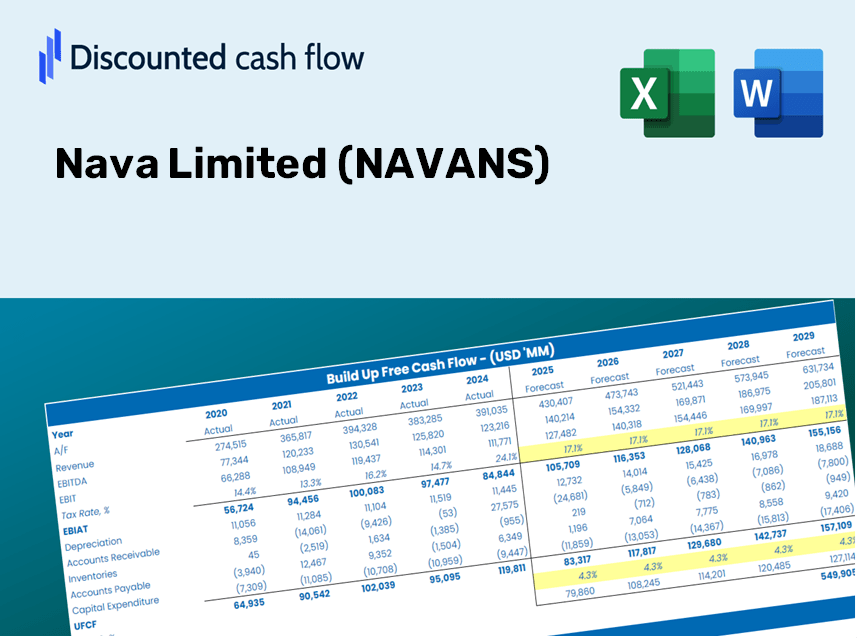
Aprimore suas estratégias de investimento com a calculadora DCF da Nava Limited (Navans)! Explore dados financeiros autênticos para a Nava Limited, ajuste as previsões e despesas do crescimento e observe o efeito imediato dessas mudanças no valor intrínseco dos navans.
Discounted Cash Flow (DCF) - (USD MM)
| Year | AY1 2021 |
AY2 2022 |
AY3 2023 |
AY4 2024 |
AY5 2025 |
FY1 2026 |
FY2 2027 |
FY3 2028 |
FY4 2029 |
FY5 2030 |
|---|---|---|---|---|---|---|---|---|---|---|
| Revenue | 25,305.3 | 33,476.6 | 35,083.2 | 38,019.6 | 39,835.5 | 44,838.4 | 50,469.6 | 56,808.1 | 63,942.6 | 71,973.1 |
| Revenue Growth, % | 0 | 32.29 | 4.8 | 8.37 | 4.78 | 12.56 | 12.56 | 12.56 | 12.56 | 12.56 |
| EBITDA | 13,185.5 | 15,214.2 | 19,666.7 | 19,707.4 | 19,867.8 | 22,896.2 | 25,771.8 | 29,008.4 | 32,651.6 | 36,752.3 |
| EBITDA, % | 52.11 | 45.45 | 56.06 | 51.83 | 49.87 | 51.06 | 51.06 | 51.06 | 51.06 | 51.06 |
| Depreciation | 3,026.3 | 2,969.9 | 3,078.8 | 3,208.6 | 3,524.1 | 4,205.2 | 4,733.3 | 5,327.8 | 5,996.9 | 6,750.0 |
| Depreciation, % | 11.96 | 8.87 | 8.78 | 8.44 | 8.85 | 9.38 | 9.38 | 9.38 | 9.38 | 9.38 |
| EBIT | 10,159.2 | 12,244.3 | 16,587.9 | 16,498.8 | 16,343.7 | 18,691.1 | 21,038.5 | 23,680.7 | 26,654.7 | 30,002.3 |
| EBIT, % | 40.15 | 36.58 | 47.28 | 43.4 | 41.03 | 41.69 | 41.69 | 41.69 | 41.69 | 41.69 |
| Total Cash | 6,441.9 | 8,255.9 | 8,331.2 | 7,725.1 | 15,920.3 | 12,030.1 | 13,540.9 | 15,241.5 | 17,155.7 | 19,310.3 |
| Total Cash, percent | .0 | .0 | .0 | .0 | .0 | .0 | .0 | .0 | .0 | .0 |
| Account Receivables | 9,173.8 | 10,973.7 | 23,461.2 | 17,954.2 | 14,094.6 | 19,595.4 | 22,056.4 | 24,826.4 | 27,944.4 | 31,453.9 |
| Account Receivables, % | 36.25 | 32.78 | 66.87 | 47.22 | 35.38 | 43.7 | 43.7 | 43.7 | 43.7 | 43.7 |
| Inventories | 2,946.9 | 3,706.7 | 6,884.0 | 6,027.4 | 8,176.8 | 7,059.3 | 7,945.9 | 8,943.8 | 10,067.1 | 11,331.4 |
| Inventories, % | 11.65 | 11.07 | 19.62 | 15.85 | 20.53 | 15.74 | 15.74 | 15.74 | 15.74 | 15.74 |
| Accounts Payable | 731.5 | 859.0 | 1,642.6 | 1,695.7 | 1,683.9 | 1,688.3 | 1,900.3 | 2,139.0 | 2,407.6 | 2,710.0 |
| Accounts Payable, % | 2.89 | 2.57 | 4.68 | 4.46 | 4.23 | 3.77 | 3.77 | 3.77 | 3.77 | 3.77 |
| Capital Expenditure | -328.2 | -626.8 | -1,004.6 | -1,655.2 | -8,519.0 | -2,849.2 | -3,207.0 | -3,609.8 | -4,063.2 | -4,573.5 |
| Capital Expenditure, % | -1.3 | -1.87 | -2.86 | -4.35 | -21.39 | -6.35 | -6.35 | -6.35 | -6.35 | -6.35 |
| Tax Rate, % | 32.14 | 32.14 | 32.14 | 32.14 | 32.14 | 32.14 | 32.14 | 32.14 | 32.14 | 32.14 |
| EBITAT | 6,402.7 | 7,130.8 | 12,172.2 | 11,296.4 | 11,090.4 | 12,372.3 | 13,926.1 | 15,675.1 | 17,643.7 | 19,859.5 |
| Depreciation | ||||||||||
| Changes in Account Receivables | ||||||||||
| Changes in Inventories | ||||||||||
| Changes in Accounts Payable | ||||||||||
| Capital Expenditure | ||||||||||
| UFCF | -2,288.4 | 7,041.8 | -634.9 | 19,266.5 | 7,793.9 | 9,349.3 | 12,316.8 | 13,863.7 | 15,604.8 | 17,564.7 |
| WACC, % | 4.58 | 4.57 | 4.6 | 4.59 | 4.59 | 4.59 | 4.59 | 4.59 | 4.59 | 4.59 |
| PV UFCF | ||||||||||
| SUM PV UFCF | 59,398.4 | |||||||||
| Long Term Growth Rate, % | 3.50 | |||||||||
| Free cash flow (T + 1) | 18,179 | |||||||||
| Terminal Value | 1,674,290 | |||||||||
| Present Terminal Value | 1,338,034 | |||||||||
| Enterprise Value | 1,397,432 | |||||||||
| Net Debt | -962 | |||||||||
| Equity Value | 1,398,395 | |||||||||
| Diluted Shares Outstanding, MM | 290 | |||||||||
| Equity Value Per Share | 4,821.12 |
What You Will Receive
- Customizable Excel Template: An adaptable Excel-based DCF Calculator featuring pre-loaded financial data for Nava Limited (NAVANS).
- Real-World Insights: Access to historical information and projections (highlighted in the yellow cells).
- Flexible Forecasting: Adjust key assumptions such as revenue growth, EBITDA margin, and WACC with ease.
- Instant Calculations: Quickly observe how your changes affect the valuation of Nava Limited (NAVANS).
- Professional-Grade Tool: Designed for investors, CFOs, consultants, and financial analysts.
- Intuitive Layout: Organized for clarity and simplicity, complete with step-by-step guidance.
Key Features
- Pre-Loaded Data: Nava Limited’s historical financial statements and pre-filled forecasts.
- Fully Adjustable Inputs: Modify WACC, tax rates, revenue growth, and EBITDA margins as needed.
- Instant Results: Watch Nava Limited’s intrinsic value update in real time.
- Clear Visual Outputs: Dashboard charts illustrate valuation outcomes and essential metrics.
- Built for Accuracy: A robust tool designed for analysts, investors, and finance professionals.
How It Functions
- Step 1: Download the Excel file for Nava Limited (NAVANS).
- Step 2: Examine the pre-filled financial information and forecasts for Nava Limited (NAVANS).
- Step 3: Adjust key inputs such as revenue growth, WACC, and tax rates (highlighted cells) as needed.
- Step 4: Observe the DCF model update in real-time as you modify the assumptions.
- Step 5: Evaluate the outputs to inform your investment decisions regarding Nava Limited (NAVANS).
Why Choose This Calculator for Nava Limited (NAVANS)?
- All-in-One Solution: Combines DCF, WACC, and financial ratio analyses in a single platform.
- Flexible Inputs: Modify the yellow-highlighted cells to explore different scenarios.
- In-Depth Analysis: Automatically computes Nava’s intrinsic value and Net Present Value.
- Preloaded Information: Access historical and projected data for precise starting points.
- High-Quality Standards: Perfect for financial analysts, investors, and business consultants.
Who Can Benefit from Nava Limited (NAVANS)?
- Finance Students: Discover valuation strategies and implement them with actual data.
- Academics: Use professional models to enhance your teaching or research efforts.
- Investors: Challenge your own assumptions and evaluate valuation results for Nava Limited (NAVANS).
- Analysts: Improve your efficiency with a customizable, pre-designed DCF model.
- Small Business Owners: Understand how large public companies like Nava Limited (NAVANS) are evaluated.
Contents of the Template
- Operating and Balance Sheet Data: Pre-filled historical data and forecasts for Nava Limited (NAVANS), including revenue, EBITDA, EBIT, and capital expenditures.
- WACC Calculation: A dedicated sheet for calculating the Weighted Average Cost of Capital (WACC), featuring parameters such as Beta, risk-free rate, and share price.
- DCF Valuation (Unlevered and Levered): Customizable Discounted Cash Flow models illustrating intrinsic value, complete with detailed calculations.
- Financial Statements: Pre-loaded annual and quarterly financial statements to facilitate analysis.
- Key Ratios: Includes profitability, leverage, and efficiency ratios specific to Nava Limited (NAVANS).
- Dashboard and Charts: A visual summary of valuation outputs and assumptions for easy results analysis.
Disclaimer
All information, articles, and product details provided on this website are for general informational and educational purposes only. We do not claim any ownership over, nor do we intend to infringe upon, any trademarks, copyrights, logos, brand names, or other intellectual property mentioned or depicted on this site. Such intellectual property remains the property of its respective owners, and any references here are made solely for identification or informational purposes, without implying any affiliation, endorsement, or partnership.
We make no representations or warranties, express or implied, regarding the accuracy, completeness, or suitability of any content or products presented. Nothing on this website should be construed as legal, tax, investment, financial, medical, or other professional advice. In addition, no part of this site—including articles or product references—constitutes a solicitation, recommendation, endorsement, advertisement, or offer to buy or sell any securities, franchises, or other financial instruments, particularly in jurisdictions where such activity would be unlawful.
All content is of a general nature and may not address the specific circumstances of any individual or entity. It is not a substitute for professional advice or services. Any actions you take based on the information provided here are strictly at your own risk. You accept full responsibility for any decisions or outcomes arising from your use of this website and agree to release us from any liability in connection with your use of, or reliance upon, the content or products found herein.