
|
NBCC Limited (NBCC.NS) Avaliação DCF |
Totalmente Editável: Adapte-Se Às Suas Necessidades No Excel Ou Planilhas
Design Profissional: Modelos Confiáveis E Padrão Da Indústria
Pré-Construídos Para Uso Rápido E Eficiente
Compatível com MAC/PC, totalmente desbloqueado
Não É Necessária Experiência; Fácil De Seguir
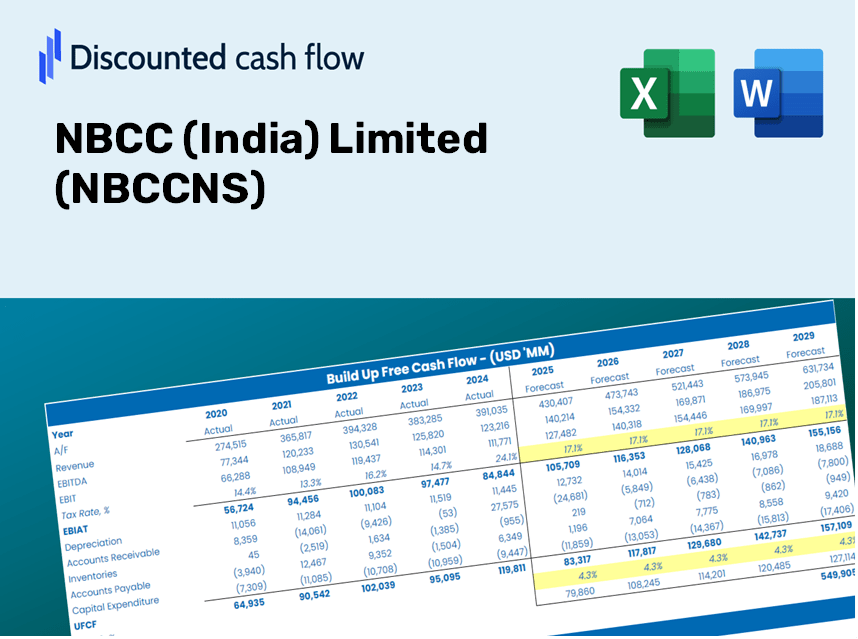
NBCC (India) Limited (NBCC.NS) Bundle
Explore as perspectivas financeiras da NBCC (Índia) Limited (NBCCNS) com nossa calculadora DCF amigável! Digite suas projeções de crescimento, margens e despesas para determinar o valor intrínseco da NBCC (Índia) Limited (NBCCNS) e aprimorar sua estratégia de investimento.
Discounted Cash Flow (DCF) - (USD MM)
| Year | AY1 2021 |
AY2 2022 |
AY3 2023 |
AY4 2024 |
AY5 2025 |
FY1 2026 |
FY2 2027 |
FY3 2028 |
FY4 2029 |
FY5 2030 |
|---|---|---|---|---|---|---|---|---|---|---|
| Revenue | 68,849.9 | 75,915.8 | 87,836.2 | 105,003.9 | 121,681.2 | 140,357.0 | 161,899.2 | 186,747.8 | 215,410.1 | 248,471.6 |
| Revenue Growth, % | 0 | 10.26 | 15.7 | 19.55 | 15.88 | 15.35 | 15.35 | 15.35 | 15.35 | 15.35 |
| EBITDA | 985.3 | 1,763.9 | 3,336.7 | 6,080.2 | 7,293.4 | 5,428.3 | 6,261.5 | 7,222.5 | 8,331.0 | 9,609.7 |
| EBITDA, % | 1.43 | 2.32 | 3.8 | 5.79 | 5.99 | 3.87 | 3.87 | 3.87 | 3.87 | 3.87 |
| Depreciation | 51.7 | 45.5 | 49.3 | 40.8 | 49.2 | 75.9 | 87.6 | 101.0 | 116.5 | 134.4 |
| Depreciation, % | 0.07509817 | 0.0599796 | 0.05612035 | 0.03883667 | 0.04041627 | 0.05409021 | 0.05409021 | 0.05409021 | 0.05409021 | 0.05409021 |
| EBIT | 933.6 | 1,718.4 | 3,287.4 | 6,039.4 | 7,244.3 | 5,352.4 | 6,173.9 | 7,121.5 | 8,214.5 | 9,475.3 |
| EBIT, % | 1.36 | 2.26 | 3.74 | 5.75 | 5.95 | 3.81 | 3.81 | 3.81 | 3.81 | 3.81 |
| Total Cash | 55,157.5 | 55,657.8 | 52,306.8 | 52,570.7 | 59,620.5 | 87,594.3 | 101,038.4 | 116,545.9 | 134,433.6 | 155,066.6 |
| Total Cash, percent | .0 | .0 | .0 | .0 | .0 | .0 | .0 | .0 | .0 | .0 |
| Account Receivables | 27,624.9 | 26,408.5 | 24,926.1 | 32,751.4 | 30,616.2 | 44,813.1 | 51,691.0 | 59,624.6 | 68,775.9 | 79,331.8 |
| Account Receivables, % | 40.12 | 34.79 | 28.38 | 31.19 | 25.16 | 31.93 | 31.93 | 31.93 | 31.93 | 31.93 |
| Inventories | 16,937.1 | 15,157.1 | 14,077.1 | 12,021.1 | 9,739.8 | 22,469.7 | 25,918.4 | 29,896.4 | 34,484.9 | 39,777.7 |
| Inventories, % | 24.6 | 19.97 | 16.03 | 11.45 | 8 | 16.01 | 16.01 | 16.01 | 16.01 | 16.01 |
| Accounts Payable | 32,654.7 | 32,687.4 | 34,971.8 | 41,211.0 | 47,562.9 | 58,567.2 | 67,556.1 | 77,924.8 | 89,884.8 | 103,680.4 |
| Accounts Payable, % | 47.43 | 43.06 | 39.81 | 39.25 | 39.09 | 41.73 | 41.73 | 41.73 | 41.73 | 41.73 |
| Capital Expenditure | -51.2 | -64.6 | -112.2 | -447.9 | -3,198.1 | -938.1 | -1,082.1 | -1,248.2 | -1,439.8 | -1,660.8 |
| Capital Expenditure, % | -0.07438357 | -0.08504157 | -0.1277 | -0.4266 | -2.63 | -0.6684 | -0.6684 | -0.6684 | -0.6684 | -0.6684 |
| Tax Rate, % | 28.33 | 28.33 | 28.33 | 28.33 | 28.33 | 28.33 | 28.33 | 28.33 | 28.33 | 28.33 |
| EBITAT | 720.8 | 1,224.7 | 2,357.1 | 4,342.0 | 5,192.1 | 3,893.9 | 4,491.5 | 5,180.9 | 5,976.1 | 6,893.3 |
| Depreciation | ||||||||||
| Changes in Account Receivables | ||||||||||
| Changes in Inventories | ||||||||||
| Changes in Accounts Payable | ||||||||||
| Capital Expenditure | ||||||||||
| UFCF | -11,186.0 | 4,234.8 | 7,141.1 | 4,404.7 | 12,811.5 | -12,890.9 | 2,159.3 | 2,490.7 | 2,873.0 | 3,313.9 |
| WACC, % | 7.16 | 7.16 | 7.16 | 7.16 | 7.16 | 7.16 | 7.16 | 7.16 | 7.16 | 7.16 |
| PV UFCF | ||||||||||
| SUM PV UFCF | -3,601.5 | |||||||||
| Long Term Growth Rate, % | 3.00 | |||||||||
| Free cash flow (T + 1) | 3,413 | |||||||||
| Terminal Value | 82,027 | |||||||||
| Present Terminal Value | 58,045 | |||||||||
| Enterprise Value | 54,444 | |||||||||
| Net Debt | -57,154 | |||||||||
| Equity Value | 111,598 | |||||||||
| Diluted Shares Outstanding, MM | 2,700 | |||||||||
| Equity Value Per Share | 41.33 |
What You Will Receive
- Authentic NBCC (India) Limited Financial Data: Pre-loaded with historical and projected figures for accurate assessments.
- Completely Customizable Template: Easily adjust essential inputs such as revenue growth, WACC, and EBITDA %.
- Instant Calculations: Observe real-time updates of NBCC's intrinsic value as you make adjustments.
- Expert Valuation Tool: Tailored for investors, analysts, and consultants aiming for precise DCF outcomes.
- User-Friendly Layout: Intuitive structure and straightforward guidance suitable for all skill levels.
Key Features
- Real-Time NBCC Data: Pre-loaded with NBCC (India) Limited's historical financials along with projected growth metrics.
- Customizable Parameters: Modify revenue growth rates, profit margins, WACC, tax rates, and capital expenditures as needed.
- Dynamic Valuation Framework: Automatically refreshes Net Present Value (NPV) and intrinsic value in response to your inputs.
- Scenario Analysis: Develop various forecast scenarios to examine different potential valuation results.
- User-Friendly Interface: Intuitive and organized, suitable for both seasoned professionals and newcomers.
How It Works
- Step 1: Download the Excel file.
- Step 2: Review the pre-loaded NBCC (India) Limited (NBCCNS) data (historical and projected).
- Step 3: Modify key assumptions (yellow cells) according to your analysis.
- Step 4: Observe automatic recalculations to determine the intrinsic value of NBCC (India) Limited (NBCCNS).
- Step 5: Utilize the results for investment decisions or reporting purposes.
Why Opt for NBCC (India) Limited (NBCCNS) Calculator?
- Time-Saving: Skip the hassle of building a DCF model from the ground up – it’s immediately accessible.
- Enhanced Accuracy: Dependable financial information and formulas minimize valuation errors.
- Completely Customizable: Adjust the model to align with your unique assumptions and forecasts.
- User-Friendly: Intuitive charts and outputs simplify the analysis of results.
- Endorsed by Professionals: Crafted for industry experts who prioritize accuracy and functionality.
Who Should Consider NBCC (India) Limited (NBCCNS)?
- Individual Investors: Gain insights to make informed decisions on buying or selling shares of NBCC (India) Limited.
- Financial Analysts: Enhance valuation processes with comprehensive financial models tailored for NBCC (India) Limited.
- Consultants: Provide clients with accurate and timely valuation insights related to NBCC (India) Limited.
- Business Owners: Learn how large firms like NBCC (India) Limited are valued to refine your strategic approach.
- Finance Students: Develop valuation skills using real data and case studies focused on NBCC (India) Limited.
Contents of the Template
- Pre-Filled Data: Features NBCC (India) Limited’s historical financial information and projections.
- Discounted Cash Flow Model: An adjustable DCF valuation model with automated calculations.
- Weighted Average Cost of Capital (WACC): A specific sheet for computing WACC based on user-defined inputs.
- Key Financial Ratios: Evaluate NBCC (India) Limited’s profitability, efficiency, and leverage metrics.
- Customizable Inputs: Easily modify revenue growth rates, profit margins, and tax percentages.
- Clear Dashboard: Visual representations and tables summarizing essential valuation findings.
Disclaimer
All information, articles, and product details provided on this website are for general informational and educational purposes only. We do not claim any ownership over, nor do we intend to infringe upon, any trademarks, copyrights, logos, brand names, or other intellectual property mentioned or depicted on this site. Such intellectual property remains the property of its respective owners, and any references here are made solely for identification or informational purposes, without implying any affiliation, endorsement, or partnership.
We make no representations or warranties, express or implied, regarding the accuracy, completeness, or suitability of any content or products presented. Nothing on this website should be construed as legal, tax, investment, financial, medical, or other professional advice. In addition, no part of this site—including articles or product references—constitutes a solicitation, recommendation, endorsement, advertisement, or offer to buy or sell any securities, franchises, or other financial instruments, particularly in jurisdictions where such activity would be unlawful.
All content is of a general nature and may not address the specific circumstances of any individual or entity. It is not a substitute for professional advice or services. Any actions you take based on the information provided here are strictly at your own risk. You accept full responsibility for any decisions or outcomes arising from your use of this website and agree to release us from any liability in connection with your use of, or reliance upon, the content or products found herein.