
|
Avaliação DCF National Cinemedia, Inc. (NCMI) |
Totalmente Editável: Adapte-Se Às Suas Necessidades No Excel Ou Planilhas
Design Profissional: Modelos Confiáveis E Padrão Da Indústria
Pré-Construídos Para Uso Rápido E Eficiente
Compatível com MAC/PC, totalmente desbloqueado
Não É Necessária Experiência; Fácil De Seguir
National CineMedia, Inc. (NCMI) Bundle
Atualizar sua análise e aumentar a precisão com a nossa calculadora DCF (NCMI)! Com dados nacionais da Cinemedia reais e suposições personalizáveis, essa ferramenta permite que você preveja, analise e avalie (NCMI), assim como um investidor especialista.
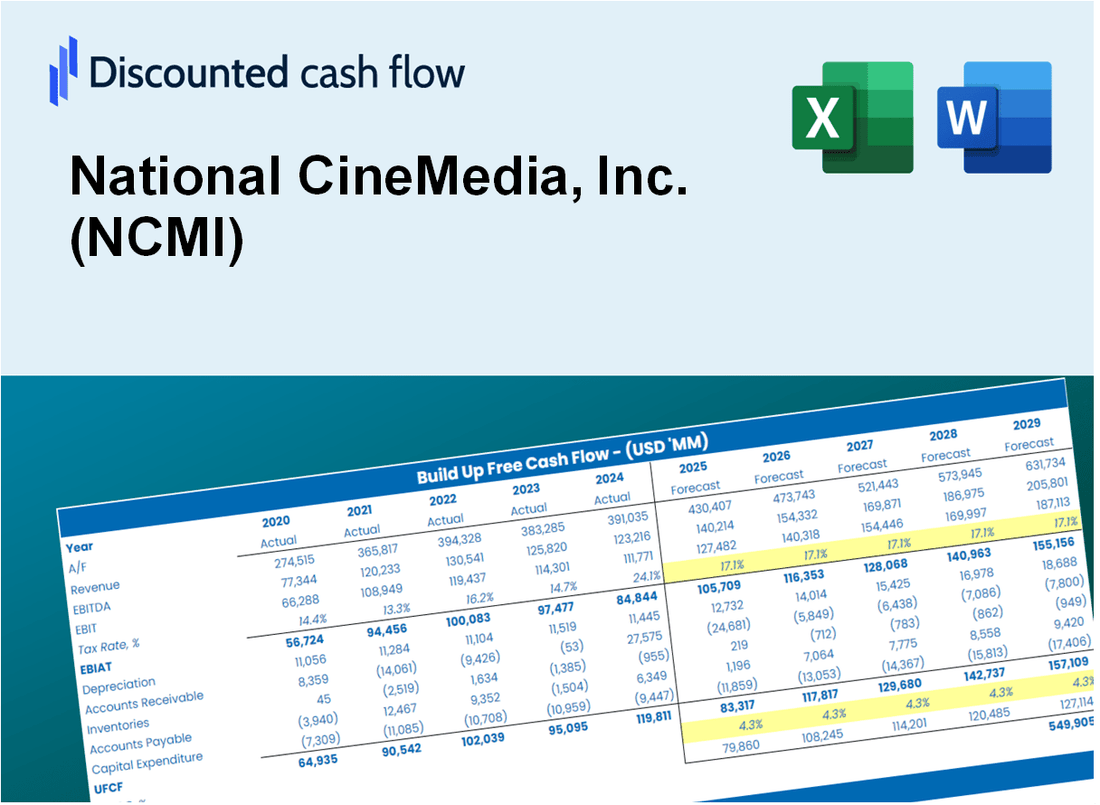
Discounted Cash Flow (DCF) - (USD MM)
| Year | AY1 2020 |
AY2 2021 |
AY3 2022 |
AY4 2023 |
AY5 2024 |
FY1 2025 |
FY2 2026 |
FY3 2027 |
FY4 2028 |
FY5 2029 |
|---|---|---|---|---|---|---|---|---|---|---|
| Revenue | 90.4 | 114.6 | 249.2 | 165.2 | 240.8 | 324.4 | 436.9 | 588.6 | 792.9 | 1,068.1 |
| Revenue Growth, % | 0 | 26.77 | 117.45 | -33.71 | 45.76 | 34.71 | 34.71 | 34.71 | 34.71 | 34.71 |
| EBITDA | 129.0 | -18.2 | 45.0 | 750.1 | 22.0 | 137.1 | 184.7 | 248.8 | 335.1 | 451.4 |
| EBITDA, % | 142.7 | -15.88 | 18.06 | 454.06 | 9.14 | 42.26 | 42.26 | 42.26 | 42.26 | 42.26 |
| Depreciation | 37.3 | 35.4 | 31.5 | 25.5 | 42.4 | 76.4 | 103.0 | 138.7 | 186.9 | 251.7 |
| Depreciation, % | 41.26 | 30.89 | 12.64 | 15.44 | 17.61 | 23.57 | 23.57 | 23.57 | 23.57 | 23.57 |
| EBIT | 91.7 | -53.6 | 13.5 | 724.6 | -20.4 | 97.4 | 131.2 | 176.8 | 238.1 | 320.8 |
| EBIT, % | 101.44 | -46.77 | 5.42 | 438.62 | -8.47 | 30.03 | 30.03 | 30.03 | 30.03 | 30.03 |
| Total Cash | 181.8 | 102.5 | 62.4 | 34.6 | 75.2 | 173.0 | 233.0 | 313.9 | 422.9 | 569.6 |
| Total Cash, percent | .0 | .0 | .0 | .0 | .0 | .0 | .0 | .0 | .0 | .0 |
| Account Receivables | 16.2 | 53.0 | 92.0 | 96.6 | 85.3 | 126.5 | 170.4 | 229.5 | 309.2 | 416.5 |
| Account Receivables, % | 17.92 | 46.25 | 36.92 | 58.47 | 35.42 | 39 | 39 | 39 | 39 | 39 |
| Inventories | -1.2 | -1.0 | 2.1 | .0 | .0 | -.9 | -1.2 | -1.6 | -2.2 | -2.9 |
| Inventories, % | -1.33 | -0.8726 | 0.8427 | 0 | 0 | -0.27147 | -0.27147 | -0.27147 | -0.27147 | -0.27147 |
| Accounts Payable | 13.7 | 16.3 | 25.0 | 21.7 | 23.0 | 40.3 | 54.3 | 73.1 | 98.5 | 132.6 |
| Accounts Payable, % | 15.15 | 14.22 | 10.03 | 13.14 | 9.55 | 12.42 | 12.42 | 12.42 | 12.42 | 12.42 |
| Capital Expenditure | -8.0 | -5.7 | -2.9 | -3.3 | -5.8 | -12.6 | -16.9 | -22.8 | -30.8 | -41.4 |
| Capital Expenditure, % | -8.85 | -4.97 | -1.16 | -2 | -2.41 | -3.88 | -3.88 | -3.88 | -3.88 | -3.88 |
| Tax Rate, % | -0.90498 | -0.90498 | -0.90498 | -0.90498 | -0.90498 | -0.90498 | -0.90498 | -0.90498 | -0.90498 | -0.90498 |
| EBITAT | -322.6 | -51.4 | 5.8 | 733.4 | -20.6 | 66.1 | 89.0 | 119.9 | 161.5 | 217.5 |
| Depreciation | ||||||||||
| Changes in Account Receivables | ||||||||||
| Changes in Inventories | ||||||||||
| Changes in Accounts Payable | ||||||||||
| Capital Expenditure | ||||||||||
| UFCF | -294.6 | -56.1 | 1.0 | 749.8 | 28.6 | 106.9 | 145.4 | 195.9 | 263.9 | 355.4 |
| WACC, % | 11.94 | 12.31 | 12.11 | 12.32 | 12.32 | 12.2 | 12.2 | 12.2 | 12.2 | 12.2 |
| PV UFCF | ||||||||||
| SUM PV UFCF | 715.8 | |||||||||
| Long Term Growth Rate, % | 2.00 | |||||||||
| Free cash flow (T + 1) | 363 | |||||||||
| Terminal Value | 3,554 | |||||||||
| Present Terminal Value | 1,999 | |||||||||
| Enterprise Value | 2,714 | |||||||||
| Net Debt | -51 | |||||||||
| Equity Value | 2,765 | |||||||||
| Diluted Shares Outstanding, MM | 96 | |||||||||
| Equity Value Per Share | 28.84 |
What You Will Get
- Pre-Filled Financial Model: National CineMedia’s (NCMI) actual data allows for accurate DCF valuation.
- Full Forecast Control: Modify revenue growth, profit margins, WACC, and other essential drivers.
- Instant Calculations: Automatic updates provide real-time results as you adjust inputs.
- Investor-Ready Template: A polished Excel file crafted for professional-level valuation.
- Customizable and Reusable: Designed for versatility, enabling repeated use for comprehensive forecasts.
Key Features
- Pre-Loaded Data: National CineMedia, Inc.'s (NCMI) historical financial statements and pre-filled forecasts.
- Fully Adjustable Inputs: Modify WACC, tax rates, revenue growth, and EBITDA margins as needed.
- Instant Results: View National CineMedia, Inc.'s (NCMI) intrinsic value recalculating in real time.
- Clear Visual Outputs: Dashboard charts present valuation results and essential metrics.
- Built for Accuracy: A professional tool designed for analysts, investors, and finance professionals.
How It Works
- 1. Access the Template: Download and open the Excel file containing National CineMedia, Inc.'s (NCMI) preloaded data.
- 2. Adjust Key Inputs: Modify essential variables such as growth projections, WACC, and capital expenditures.
- 3. Analyze Results Immediately: The DCF model automatically computes intrinsic value and NPV in real-time.
- 4. Explore Various Scenarios: Evaluate different forecasts to assess a range of valuation possibilities.
- 5. Present with Assurance: Deliver professional valuation findings to back your strategic decisions.
Why Choose This Calculator for National CineMedia, Inc. (NCMI)?
- Comprehensive Tool: Combines DCF, WACC, and financial ratio analyses tailored for NCMI.
- Customizable Inputs: Modify yellow-highlighted cells to explore different financial scenarios.
- Detailed Insights: Automatically computes National CineMedia's intrinsic value and Net Present Value.
- Preloaded Data: Historical and projected data provide reliable starting points for analysis.
- Professional Quality: Perfect for financial analysts, investors, and business consultants focusing on NCMI.
Who Should Use National CineMedia, Inc. (NCMI)?
- Advertisers: Reach a broad audience through targeted cinema advertising with confidence.
- Media Buyers: Streamline your campaigns using NCMI's comprehensive advertising solutions.
- Content Creators: Leverage cinema as a platform to showcase your work to engaged audiences.
- Market Researchers: Analyze audience engagement and behavior in the cinema environment.
- Students and Educators: Explore the dynamics of cinema advertising and its impact on consumer behavior.
What the Template Contains
- Preloaded NCMI Data: Historical and projected financial data, including revenue, EBIT, and capital expenditures.
- DCF and WACC Models: Professional-grade sheets for calculating intrinsic value and Weighted Average Cost of Capital.
- Editable Inputs: Yellow-highlighted cells for adjusting revenue growth, tax rates, and discount rates.
- Financial Statements: Comprehensive annual and quarterly financials for deeper analysis.
- Key Ratios: Profitability, leverage, and efficiency ratios to evaluate performance.
- Dashboard and Charts: Visual summaries of valuation outcomes and assumptions.
Disclaimer
All information, articles, and product details provided on this website are for general informational and educational purposes only. We do not claim any ownership over, nor do we intend to infringe upon, any trademarks, copyrights, logos, brand names, or other intellectual property mentioned or depicted on this site. Such intellectual property remains the property of its respective owners, and any references here are made solely for identification or informational purposes, without implying any affiliation, endorsement, or partnership.
We make no representations or warranties, express or implied, regarding the accuracy, completeness, or suitability of any content or products presented. Nothing on this website should be construed as legal, tax, investment, financial, medical, or other professional advice. In addition, no part of this site—including articles or product references—constitutes a solicitation, recommendation, endorsement, advertisement, or offer to buy or sell any securities, franchises, or other financial instruments, particularly in jurisdictions where such activity would be unlawful.
All content is of a general nature and may not address the specific circumstances of any individual or entity. It is not a substitute for professional advice or services. Any actions you take based on the information provided here are strictly at your own risk. You accept full responsibility for any decisions or outcomes arising from your use of this website and agree to release us from any liability in connection with your use of, or reliance upon, the content or products found herein.