|
Nucana PLC (NCNA) DCF Avaliação |
Totalmente Editável: Adapte-Se Às Suas Necessidades No Excel Ou Planilhas
Design Profissional: Modelos Confiáveis E Padrão Da Indústria
Pré-Construídos Para Uso Rápido E Eficiente
Compatível com MAC/PC, totalmente desbloqueado
Não É Necessária Experiência; Fácil De Seguir
NuCana plc (NCNA) Bundle
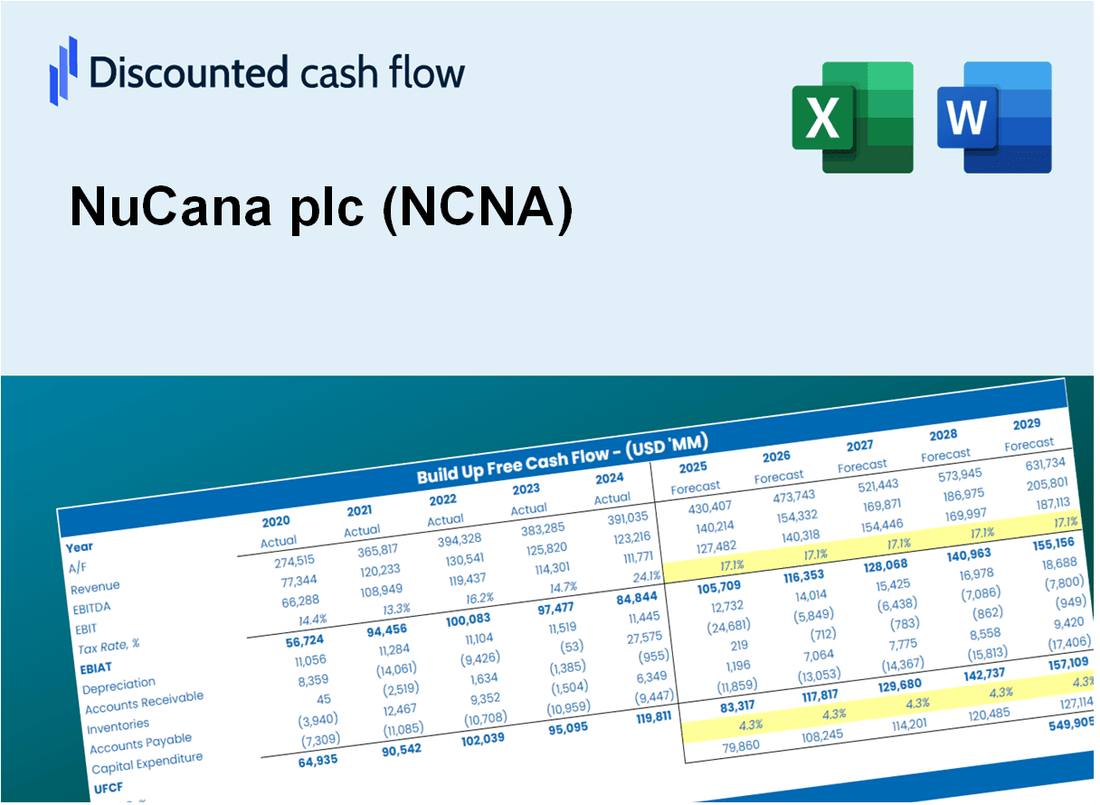
Procurando determinar o valor intrínseco da Nucana PLC? Nossa calculadora DCF (NCNA) integra dados do mundo real com extensos recursos de personalização, permitindo ajustar as previsões e aprimorar suas estratégias de investimento.
Discounted Cash Flow (DCF) - (USD MM)
| Year | AY1 2020 |
AY2 2021 |
AY3 2022 |
AY4 2023 |
AY5 2024 |
FY1 2025 |
FY2 2026 |
FY3 2027 |
FY4 2028 |
FY5 2029 |
|---|---|---|---|---|---|---|---|---|---|---|
| Revenue | .0 | .0 | .0 | .0 | .0 | .0 | .0 | .0 | .0 | .0 |
| Revenue Growth, % | 0 | 0 | 0 | 0 | 0 | 0 | 0 | 0 | 0 | 0 |
| EBITDA | .0 | -55.1 | -68.6 | -41.8 | -29.6 | .0 | .0 | .0 | .0 | .0 |
| EBITDA, % | 100 | 100 | 100 | 100 | 100 | 100 | 100 | 100 | 100 | 100 |
| Depreciation | 1.2 | 1.2 | 1.0 | .8 | .7 | .0 | .0 | .0 | .0 | .0 |
| Depreciation, % | 100 | 100 | 100 | 100 | 100 | 100 | 100 | 100 | 100 | 100 |
| EBIT | -1.2 | -56.3 | -69.6 | -42.6 | -30.3 | .0 | .0 | .0 | .0 | .0 |
| EBIT, % | 100 | 100 | 100 | 100 | 100 | 100 | 100 | 100 | 100 | 100 |
| Total Cash | 114.9 | 79.3 | 55.1 | 22.7 | 8.9 | .0 | .0 | .0 | .0 | .0 |
| Total Cash, percent | .0 | .0 | .0 | .0 | .0 | .0 | .0 | .0 | .0 | .0 |
| Account Receivables | .0 | .0 | .1 | 7.7 | 6.1 | .0 | .0 | .0 | .0 | .0 |
| Account Receivables, % | 100 | 100 | 100 | 100 | 100 | 100 | 100 | 100 | 100 | 100 |
| Inventories | .0 | .0 | .0 | .0 | .0 | .0 | .0 | .0 | .0 | .0 |
| Inventories, % | 100 | 100 | 100 | 100 | 100 | 100 | 100 | 100 | 100 | 100 |
| Accounts Payable | 3.0 | 2.4 | 6.3 | 4.4 | 3.6 | .0 | .0 | .0 | .0 | .0 |
| Accounts Payable, % | 100 | 100 | 100 | 100 | 100 | 100 | 100 | 100 | 100 | 100 |
| Capital Expenditure | -2.1 | -1.4 | -.7 | -.6 | -.4 | .0 | .0 | .0 | .0 | .0 |
| Capital Expenditure, % | 100 | 100 | 100 | 100 | 100 | 0 | 0 | 0 | 0 | 0 |
| Tax Rate, % | 15.38 | 15.38 | 15.38 | 15.38 | 15.38 | 15.38 | 15.38 | 15.38 | 15.38 | 15.38 |
| EBITAT | -1.0 | -47.8 | -57.9 | -36.7 | -25.6 | .0 | .0 | .0 | .0 | .0 |
| Depreciation | ||||||||||
| Changes in Account Receivables | ||||||||||
| Changes in Inventories | ||||||||||
| Changes in Accounts Payable | ||||||||||
| Capital Expenditure | ||||||||||
| UFCF | 1.0 | -48.5 | -53.8 | -46.1 | -24.6 | 2.5 | .0 | .0 | .0 | .0 |
| WACC, % | 9.44 | 9.44 | 9.42 | 9.45 | 9.44 | 9.44 | 9.44 | 9.44 | 9.44 | 9.44 |
| PV UFCF | ||||||||||
| SUM PV UFCF | 2.3 | |||||||||
| Long Term Growth Rate, % | 2.00 | |||||||||
| Free cash flow (T + 1) | 0 | |||||||||
| Terminal Value | 0 | |||||||||
| Present Terminal Value | 0 | |||||||||
| Enterprise Value | 2 | |||||||||
| Net Debt | -9 | |||||||||
| Equity Value | 11 | |||||||||
| Diluted Shares Outstanding, MM | 0 | |||||||||
| Equity Value Per Share | 46.12 |
What You Will Get
- Comprehensive NCNA Financials: Access to historical and projected data for precise valuation.
- Customizable Parameters: Adjust WACC, tax rates, revenue growth, and capital expenditures as needed.
- Dynamic Calculations: Intrinsic value and NPV are computed in real-time.
- Scenario Analysis: Explore various scenarios to assess NuCana's future performance.
- User-Friendly Interface: Designed for professionals while remaining approachable for newcomers.
Key Features
- Customizable Clinical Parameters: Adjust key metrics such as trial phases, patient demographics, and treatment regimens.
- Instant DCF Analysis: Provides immediate calculations of intrinsic value, NPV, and other financial metrics.
- High Precision Results: Utilizes NuCana plc's (NCNA) actual financial data for accurate valuation assessments.
- Simplified Scenario Testing: Easily evaluate various hypotheses and analyze results side-by-side.
- Efficiency Booster: Removes the necessity of constructing intricate valuation models from the ground up.
How It Works
- Step 1: Download the Excel file for NuCana plc (NCNA).
- Step 2: Review NuCana’s pre-filled financial data and forecasts.
- Step 3: Modify key inputs such as revenue growth, WACC, and tax rates (highlighted cells).
- Step 4: Observe the DCF model update in real-time as you adjust your assumptions.
- Step 5: Analyze the outputs and leverage the results for your investment decisions.
Why Choose This Calculator for NuCana plc (NCNA)?
- User-Friendly Interface: Tailored for both novice and experienced users.
- Customizable Inputs: Adjust parameters to accurately represent your financial analysis.
- Real-Time Feedback: Observe immediate updates to NuCana's valuation as you change inputs.
- Preloaded Data: Comes with NuCana's actual financial metrics for efficient evaluation.
- Relied Upon by Experts: Utilized by analysts and investors for strategic decision-making.
Who Should Use This Product?
- Pharmaceutical Students: Understand drug development processes and apply them using real-world case studies.
- Researchers: Utilize advanced models for analyzing clinical trial data and outcomes.
- Investors: Evaluate your investment strategies and assess the potential of NuCana plc (NCNA) stock.
- Market Analysts: Enhance your analysis with a customizable model tailored for biotech companies.
- Healthcare Professionals: Gain insights into how innovative biotech firms like NuCana plc (NCNA) are assessed in the market.
What the Template Contains
- Pre-Filled Data: Contains NuCana plc's historical financials and projections.
- Discounted Cash Flow Model: Editable DCF valuation model with automatic calculations for ease of use.
- Weighted Average Cost of Capital (WACC): A dedicated sheet for calculating WACC using custom inputs.
- Key Financial Ratios: Evaluate NuCana plc's profitability, efficiency, and leverage metrics.
- Customizable Inputs: Easily modify revenue growth, margins, and tax rates as needed.
- Clear Dashboard: Visual representations such as charts and tables summarizing essential valuation outcomes.
Disclaimer
All information, articles, and product details provided on this website are for general informational and educational purposes only. We do not claim any ownership over, nor do we intend to infringe upon, any trademarks, copyrights, logos, brand names, or other intellectual property mentioned or depicted on this site. Such intellectual property remains the property of its respective owners, and any references here are made solely for identification or informational purposes, without implying any affiliation, endorsement, or partnership.
We make no representations or warranties, express or implied, regarding the accuracy, completeness, or suitability of any content or products presented. Nothing on this website should be construed as legal, tax, investment, financial, medical, or other professional advice. In addition, no part of this site—including articles or product references—constitutes a solicitation, recommendation, endorsement, advertisement, or offer to buy or sell any securities, franchises, or other financial instruments, particularly in jurisdictions where such activity would be unlawful.
All content is of a general nature and may not address the specific circumstances of any individual or entity. It is not a substitute for professional advice or services. Any actions you take based on the information provided here are strictly at your own risk. You accept full responsibility for any decisions or outcomes arising from your use of this website and agree to release us from any liability in connection with your use of, or reliance upon, the content or products found herein.