|
NCS MultiStage Holdings, Inc. (NCSM) Avaliação DCF |
Totalmente Editável: Adapte-Se Às Suas Necessidades No Excel Ou Planilhas
Design Profissional: Modelos Confiáveis E Padrão Da Indústria
Pré-Construídos Para Uso Rápido E Eficiente
Compatível com MAC/PC, totalmente desbloqueado
Não É Necessária Experiência; Fácil De Seguir
NCS Multistage Holdings, Inc. (NCSM) Bundle
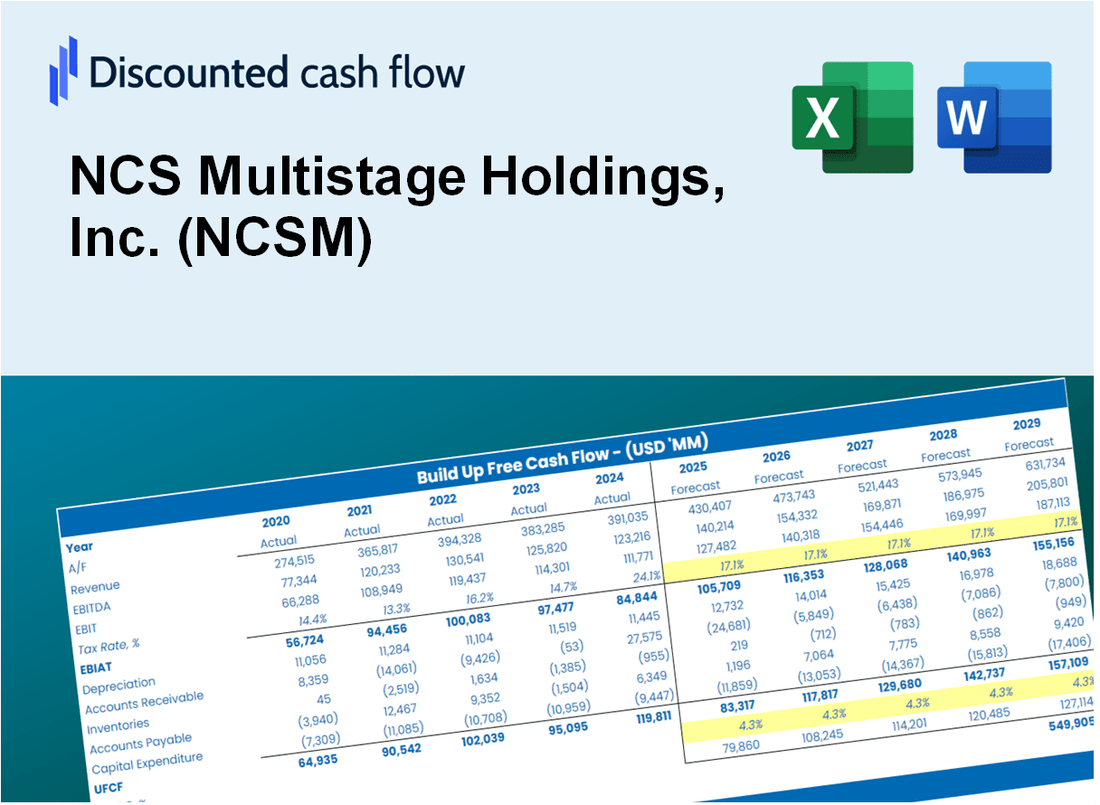
Como investidor ou analista, a calculadora DCF da NCS MultiStage Holdings, Inc. (NCSM) é o seu recurso preferido para uma avaliação precisa. Com dados reais da NCS Multistage Holdings, Inc., você pode ajustar facilmente as previsões e observar imediatamente os efeitos.
What You Will Get
- Editable Forecast Inputs: Easily modify assumptions (growth %, margins, WACC) to create various scenarios tailored to NCS Multistage Holdings, Inc. (NCSM).
- Real-World Data: NCSM's financial data pre-filled to kickstart your analysis and insights.
- Automatic DCF Outputs: The template computes Net Present Value (NPV) and intrinsic value automatically for NCSM.
- Customizable and Professional: A refined Excel model that adjusts to your specific valuation requirements for NCSM.
- Built for Analysts and Investors: Perfect for evaluating projections, validating strategies, and optimizing time efficiency regarding NCSM.
Key Features
- Customizable Financial Inputs: Adjust essential metrics such as revenue projections, operating margins, and capital investments.
- Instant DCF Valuation: Quickly computes intrinsic value, net present value (NPV), and additional financial metrics.
- High-Precision Valuation: Leverages NCS Multistage Holdings, Inc.'s (NCSM) actual financial data for accurate valuation results.
- Effortless Scenario Analysis: Evaluate various assumptions and easily compare the resulting outcomes.
- Efficiency Booster: Streamline the valuation process without the hassle of creating intricate models from the ground up.
How It Works
- Step 1: Download the Excel file.
- Step 2: Review pre-entered NCS Multistage data (historical and projected).
- Step 3: Adjust key assumptions (yellow cells) based on your analysis.
- Step 4: View automatic recalculations for NCS Multistage's intrinsic value.
- Step 5: Use the outputs for investment decisions or reporting.
Why Choose This Calculator for NCS Multistage Holdings, Inc. (NCSM)?
- Designed for Industry Experts: A sophisticated tool utilized by financial analysts, CFOs, and industry consultants.
- Comprehensive Data: NCSM's historical and projected financials are preloaded for enhanced accuracy.
- Flexible Scenario Analysis: Effortlessly simulate various forecasts and assumptions.
- Insightful Outputs: Automatically computes intrinsic value, NPV, and essential financial metrics.
- User-Friendly Interface: Step-by-step guidance makes the process straightforward.
Who Should Use This Product?
- Professional Investors: Develop comprehensive and trustworthy valuation models for portfolio assessments related to NCS Multistage Holdings, Inc. (NCSM).
- Corporate Finance Teams: Evaluate valuation scenarios to inform strategic decisions within their organizations regarding NCS Multistage Holdings, Inc. (NCSM).
- Consultants and Advisors: Deliver precise valuation insights to clients focusing on NCS Multistage Holdings, Inc. (NCSM).
- Students and Educators: Utilize authentic data to practice and teach financial modeling centered on NCS Multistage Holdings, Inc. (NCSM).
- Industry Analysts: Gain a deeper understanding of how companies like NCS Multistage Holdings, Inc. (NCSM) are valued in the market.
What the Template Contains
- Pre-Filled DCF Model: NCS Multistage Holdings’ financial data preloaded for immediate use.
- WACC Calculator: Detailed calculations for Weighted Average Cost of Capital.
- Financial Ratios: Evaluate NCS Multistage's profitability, leverage, and efficiency.
- Editable Inputs: Change assumptions such as growth, margins, and CAPEX to fit your scenarios.
- Financial Statements: Annual and quarterly reports to support detailed analysis.
- Interactive Dashboard: Easily visualize key valuation metrics and results.
Disclaimer
All information, articles, and product details provided on this website are for general informational and educational purposes only. We do not claim any ownership over, nor do we intend to infringe upon, any trademarks, copyrights, logos, brand names, or other intellectual property mentioned or depicted on this site. Such intellectual property remains the property of its respective owners, and any references here are made solely for identification or informational purposes, without implying any affiliation, endorsement, or partnership.
We make no representations or warranties, express or implied, regarding the accuracy, completeness, or suitability of any content or products presented. Nothing on this website should be construed as legal, tax, investment, financial, medical, or other professional advice. In addition, no part of this site—including articles or product references—constitutes a solicitation, recommendation, endorsement, advertisement, or offer to buy or sell any securities, franchises, or other financial instruments, particularly in jurisdictions where such activity would be unlawful.
All content is of a general nature and may not address the specific circumstances of any individual or entity. It is not a substitute for professional advice or services. Any actions you take based on the information provided here are strictly at your own risk. You accept full responsibility for any decisions or outcomes arising from your use of this website and agree to release us from any liability in connection with your use of, or reliance upon, the content or products found herein.