
|
NESCO LIMITED (NESCO.NS) Avaliação DCF |
Totalmente Editável: Adapte-Se Às Suas Necessidades No Excel Ou Planilhas
Design Profissional: Modelos Confiáveis E Padrão Da Indústria
Pré-Construídos Para Uso Rápido E Eficiente
Compatível com MAC/PC, totalmente desbloqueado
Não É Necessária Experiência; Fácil De Seguir
Nesco Limited (NESCO.NS) Bundle
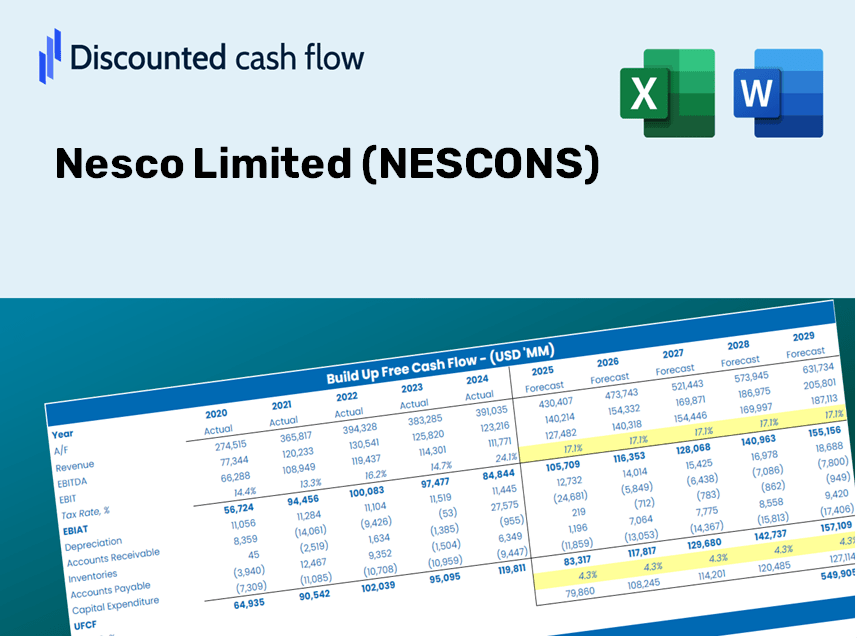
Projetado para precisão, nossa calculadora DCF (NESCONS) capacita você a avaliar a avaliação da NESCO LIMITED usando dados financeiros do mundo real, oferecendo flexibilidade completa para modificar todos os parâmetros essenciais para obter projeções aprimoradas.
Discounted Cash Flow (DCF) - (USD MM)
| Year | AY1 2021 |
AY2 2022 |
AY3 2023 |
AY4 2024 |
AY5 2025 |
FY1 2026 |
FY2 2027 |
FY3 2028 |
FY4 2029 |
FY5 2030 |
|---|---|---|---|---|---|---|---|---|---|---|
| Revenue | 2,911.0 | 3,374.0 | 5,460.0 | 6,781.8 | 7,320.1 | 9,330.9 | 11,894.0 | 15,161.2 | 19,325.9 | 24,634.7 |
| Revenue Growth, % | 0 | 15.91 | 61.83 | 24.21 | 7.94 | 27.47 | 27.47 | 27.47 | 27.47 | 27.47 |
| EBITDA | 2,421.2 | 2,548.5 | 3,803.2 | 5,312.1 | 5,514.1 | 7,129.2 | 9,087.5 | 11,583.8 | 14,765.8 | 18,821.9 |
| EBITDA, % | 83.17 | 75.53 | 69.66 | 78.33 | 75.33 | 76.4 | 76.4 | 76.4 | 76.4 | 76.4 |
| Depreciation | 257.3 | 283.1 | 132.5 | 541.7 | 499.3 | 643.1 | 819.8 | 1,045.0 | 1,332.1 | 1,698.0 |
| Depreciation, % | 8.84 | 8.39 | 2.43 | 7.99 | 6.82 | 6.89 | 6.89 | 6.89 | 6.89 | 6.89 |
| EBIT | 2,163.9 | 2,265.5 | 3,670.7 | 4,770.4 | 5,014.8 | 6,486.0 | 8,267.7 | 10,538.8 | 13,433.8 | 17,123.9 |
| EBIT, % | 74.34 | 67.15 | 67.23 | 70.34 | 68.51 | 69.51 | 69.51 | 69.51 | 69.51 | 69.51 |
| Total Cash | 1,317.7 | 2,045.9 | 4,085.8 | 3,523.1 | 2,661.7 | 5,020.8 | 6,400.0 | 8,158.1 | 10,399.1 | 13,255.7 |
| Total Cash, percent | .0 | .0 | .0 | .0 | .0 | .0 | .0 | .0 | .0 | .0 |
| Account Receivables | 582.0 | 639.9 | 957.4 | 886.4 | 778.8 | 1,496.7 | 1,907.9 | 2,432.0 | 3,100.0 | 3,951.6 |
| Account Receivables, % | 19.99 | 18.97 | 17.54 | 13.07 | 10.64 | 16.04 | 16.04 | 16.04 | 16.04 | 16.04 |
| Inventories | 126.6 | 75.2 | 117.3 | 135.6 | 104.2 | 226.8 | 289.1 | 368.5 | 469.7 | 598.7 |
| Inventories, % | 4.35 | 2.23 | 2.15 | 2 | 1.42 | 2.43 | 2.43 | 2.43 | 2.43 | 2.43 |
| Accounts Payable | 105.9 | 88.9 | 144.4 | 151.9 | 118.5 | 238.5 | 304.0 | 387.4 | 493.9 | 629.5 |
| Accounts Payable, % | 3.64 | 2.64 | 2.64 | 2.24 | 1.62 | 2.56 | 2.56 | 2.56 | 2.56 | 2.56 |
| Capital Expenditure | -576.3 | -1,487.1 | -124.0 | -1,036.8 | -7,836.3 | -3,385.8 | -4,315.9 | -5,501.4 | -7,012.6 | -8,939.0 |
| Capital Expenditure, % | -19.8 | -44.08 | -2.27 | -15.29 | -107.05 | -36.29 | -36.29 | -36.29 | -36.29 | -36.29 |
| Tax Rate, % | 23.3 | 23.3 | 23.3 | 23.3 | 23.3 | 23.3 | 23.3 | 23.3 | 23.3 | 23.3 |
| EBITAT | 1,725.2 | 1,892.4 | 2,907.2 | 3,738.0 | 3,846.6 | 5,156.7 | 6,573.2 | 8,378.8 | 10,680.5 | 13,614.3 |
| Depreciation | ||||||||||
| Changes in Account Receivables | ||||||||||
| Changes in Inventories | ||||||||||
| Changes in Accounts Payable | ||||||||||
| Capital Expenditure | ||||||||||
| UFCF | 803.5 | 664.9 | 2,611.5 | 3,303.2 | -3,384.9 | 1,693.5 | 2,669.2 | 3,402.4 | 4,337.0 | 5,528.4 |
| WACC, % | 6.11 | 6.12 | 6.11 | 6.11 | 6.11 | 6.11 | 6.11 | 6.11 | 6.11 | 6.11 |
| PV UFCF | ||||||||||
| SUM PV UFCF | 14,343.6 | |||||||||
| Long Term Growth Rate, % | 3.50 | |||||||||
| Free cash flow (T + 1) | 5,722 | |||||||||
| Terminal Value | 218,911 | |||||||||
| Present Terminal Value | 162,708 | |||||||||
| Enterprise Value | 177,052 | |||||||||
| Net Debt | -178 | |||||||||
| Equity Value | 177,229 | |||||||||
| Diluted Shares Outstanding, MM | 70 | |||||||||
| Equity Value Per Share | 2,514.89 |
Benefits You Will Receive
- Customizable Excel Template: An adaptable Excel-based DCF Calculator featuring pre-filled financial data for NESCO Limited (NESCONS).
- Accurate Data: Access to historical figures and projections for the future (highlighted in the yellow cells).
- Adjustable Forecasts: Modify key assumptions such as revenue growth, EBITDA percentage, and WACC according to your analysis.
- Instant Calculations: Quickly observe how your inputs influence the valuation of NESCO Limited (NESCONS).
- Professional-Grade Tool: Designed for investors, CFOs, consultants, and financial analysts seeking reliable insights.
- User-Friendly Interface: Organized for simplicity and accessibility, complete with detailed step-by-step instructions.
Key Features
- 🔍 Real-Life NESCONS Financials: Access to pre-filled historical and projected data for Nesco Limited.
- ✏️ Fully Customizable Inputs: Modify all essential parameters (yellow cells) such as WACC, growth %, and tax rates.
- 📊 Professional DCF Valuation: Integrated formulas to determine Nesco's intrinsic value using the Discounted Cash Flow method.
- ⚡ Instant Results: Visualize Nesco's valuation immediately after adjustments.
- Scenario Analysis: Evaluate and compare different financial assumptions side-by-side.
How It Functions
- Download: Obtain the pre-configured Excel file containing Nesco Limited’s (NESCONS) financial information.
- Customize: Modify projections, such as revenue growth, EBITDA %, and WACC.
- Update Automatically: Real-time updates for intrinsic value and NPV calculations.
- Test Scenarios: Generate various forecasts and instantly compare results.
- Make Decisions: Leverage the valuation outcomes to inform your investment strategy.
Why Opt for This Calculator?
- Reliable Data: Utilize accurate Nesco Limited (NESCONS) financials for trustworthy valuation outcomes.
- Flexible: Modify essential variables such as growth rates, WACC, and tax rates to fit your forecasts.
- Efficient: Built-in calculations save you the hassle of starting from scratch.
- Professional-Quality Tool: Crafted for investors, analysts, and consultants in mind.
- Easy to Use: User-friendly design and straightforward instructions make it accessible for everyone.
Who Can Benefit from This Product?
- Finance Students: Master valuation techniques and apply them with real-world data.
- Academics: Integrate professional models into your coursework or research studies.
- Investors: Validate your assumptions and evaluate the valuation results for Nesco Limited (NESCONS).
- Analysts: Enhance your efficiency with a customizable, pre-built DCF model.
- Small Business Owners: Discover how large publicly traded companies like Nesco Limited (NESCONS) are analyzed.
Contents of the Template
- Historical Data: Provides a comprehensive overview of Nesco Limited's (NESCONS) past financial performance and foundational forecasts.
- DCF and Levered DCF Models: In-depth templates for assessing the intrinsic value of Nesco Limited (NESCONS).
- WACC Sheet: Pre-calculated figures for the Weighted Average Cost of Capital.
- Editable Inputs: Customize essential parameters such as growth rates, EBITDA margins, and CAPEX projections.
- Quarterly and Annual Statements: A thorough analysis of Nesco Limited's (NESCONS) financial statements.
- Interactive Dashboard: Dynamic visualization of valuation results and forecasts.
Disclaimer
All information, articles, and product details provided on this website are for general informational and educational purposes only. We do not claim any ownership over, nor do we intend to infringe upon, any trademarks, copyrights, logos, brand names, or other intellectual property mentioned or depicted on this site. Such intellectual property remains the property of its respective owners, and any references here are made solely for identification or informational purposes, without implying any affiliation, endorsement, or partnership.
We make no representations or warranties, express or implied, regarding the accuracy, completeness, or suitability of any content or products presented. Nothing on this website should be construed as legal, tax, investment, financial, medical, or other professional advice. In addition, no part of this site—including articles or product references—constitutes a solicitation, recommendation, endorsement, advertisement, or offer to buy or sell any securities, franchises, or other financial instruments, particularly in jurisdictions where such activity would be unlawful.
All content is of a general nature and may not address the specific circumstances of any individual or entity. It is not a substitute for professional advice or services. Any actions you take based on the information provided here are strictly at your own risk. You accept full responsibility for any decisions or outcomes arising from your use of this website and agree to release us from any liability in connection with your use of, or reliance upon, the content or products found herein.