
|
Avaliação DCF de New Pacific Metals Corp. (Newp) |
Totalmente Editável: Adapte-Se Às Suas Necessidades No Excel Ou Planilhas
Design Profissional: Modelos Confiáveis E Padrão Da Indústria
Pré-Construídos Para Uso Rápido E Eficiente
Compatível com MAC/PC, totalmente desbloqueado
Não É Necessária Experiência; Fácil De Seguir
New Pacific Metals Corp. (NEWP) Bundle
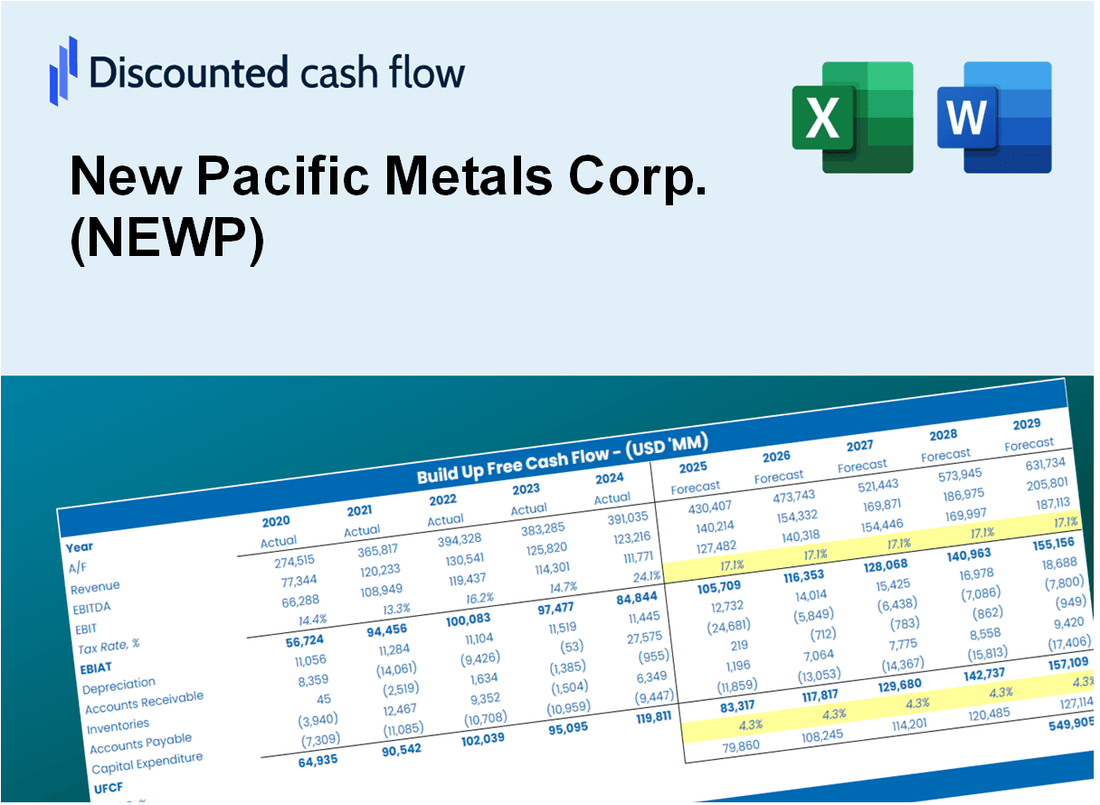
Seja você um investidor ou analista, esta calculadora DCF (newp) é o seu recurso preferido para uma avaliação precisa. Pré -carregado com dados reais da New Pacific Metals Corp., você pode ajustar as previsões e ver os efeitos imediatamente.
Discounted Cash Flow (DCF) - (USD MM)
| Year | AY1 2020 |
AY2 2021 |
AY3 2022 |
AY4 2023 |
AY5 2024 |
FY1 2025 |
FY2 2026 |
FY3 2027 |
FY4 2028 |
FY5 2029 |
|---|---|---|---|---|---|---|---|---|---|---|
| Revenue | .0 | .0 | .0 | .0 | .0 | .0 | .0 | .0 | .0 | .0 |
| Revenue Growth, % | 0 | 0 | 0 | 0 | 0 | 0 | 0 | 0 | 0 | 0 |
| EBITDA | -4.6 | -5.2 | -5.7 | -4.1 | -2.6 | .0 | .0 | .0 | .0 | .0 |
| EBITDA, % | 100 | 100 | 100 | 100 | 100 | 100 | 100 | 100 | 100 | 100 |
| Depreciation | .0 | .1 | .2 | .2 | .1 | .0 | .0 | .0 | .0 | .0 |
| Depreciation, % | 100 | 100 | 100 | 100 | 100 | 100 | 100 | 100 | 100 | 100 |
| EBIT | -4.6 | -5.3 | -5.8 | -4.3 | -2.8 | .0 | .0 | .0 | .0 | .0 |
| EBIT, % | 100 | 100 | 100 | 100 | 100 | 100 | 100 | 100 | 100 | 100 |
| Total Cash | 33.2 | 21.1 | 4.6 | 15.8 | 12.0 | .0 | .0 | .0 | .0 | .0 |
| Total Cash, percent | .0 | .0 | .0 | .0 | .0 | .0 | .0 | .0 | .0 | .0 |
| Account Receivables | .2 | 2.3 | .3 | .0 | .0 | .0 | .0 | .0 | .0 | .0 |
| Account Receivables, % | 100 | 100 | 100 | 100 | 100 | 100 | 100 | 100 | 100 | 100 |
| Inventories | .0 | .0 | -.4 | .0 | .0 | .0 | .0 | .0 | .0 | .0 |
| Inventories, % | 100 | 100 | 100 | 100 | 100 | 100 | 100 | 100 | 100 | 100 |
| Accounts Payable | .4 | 1.5 | 1.0 | .4 | .2 | .0 | .0 | .0 | .0 | .0 |
| Accounts Payable, % | 100 | 100 | 100 | 100 | 100 | 100 | 100 | 100 | 100 | 100 |
| Capital Expenditure | -3.2 | -8.3 | -14.3 | -3.5 | -2.2 | .0 | .0 | .0 | .0 | .0 |
| Capital Expenditure, % | 100 | 100 | 100 | 100 | 100 | 0 | 0 | 0 | 0 | 0 |
| Tax Rate, % | 0.6128 | 0.6128 | 0.6128 | 0.6128 | 0.6128 | 0.6128 | 0.6128 | 0.6128 | 0.6128 | 0.6128 |
| EBITAT | -4.1 | -4.2 | -5.8 | -4.3 | -2.7 | .0 | .0 | .0 | .0 | .0 |
| Depreciation | ||||||||||
| Changes in Account Receivables | ||||||||||
| Changes in Inventories | ||||||||||
| Changes in Accounts Payable | ||||||||||
| Capital Expenditure | ||||||||||
| UFCF | -7.0 | -13.4 | -18.1 | -8.3 | -5.0 | -.2 | .0 | .0 | .0 | .0 |
| WACC, % | 11.33 | 11.33 | 11.33 | 11.33 | 11.33 | 11.33 | 11.33 | 11.33 | 11.33 | 11.33 |
| PV UFCF | ||||||||||
| SUM PV UFCF | -.1 | |||||||||
| Long Term Growth Rate, % | 2.00 | |||||||||
| Free cash flow (T + 1) | 0 | |||||||||
| Terminal Value | 0 | |||||||||
| Present Terminal Value | 0 | |||||||||
| Enterprise Value | 0 | |||||||||
| Net Debt | -12 | |||||||||
| Equity Value | 12 | |||||||||
| Diluted Shares Outstanding, MM | 172 | |||||||||
| Equity Value Per Share | 0.07 |
What You Will Receive
- Comprehensive Financial Model: New Pacific Metals Corp.’s actual data facilitates accurate DCF valuation.
- Complete Forecast Control: Modify revenue growth, profit margins, WACC, and other essential drivers.
- Real-Time Calculations: Automatic updates provide immediate feedback as you make adjustments.
- Professional-Grade Template: A polished Excel file crafted for high-quality valuation presentations.
- Adaptable and Reusable: Designed for flexibility, enabling repeated application for thorough forecasts.
Key Features
- Real-Life NEWP Data: Pre-filled with New Pacific Metals Corp.'s historical financials and future projections.
- Fully Customizable Inputs: Modify revenue growth, margins, WACC, tax rates, and capital expenditures as needed.
- Dynamic Valuation Model: Automatic recalculations of Net Present Value (NPV) and intrinsic value based on your adjustments.
- Scenario Testing: Develop multiple forecast scenarios to explore various valuation results.
- User-Friendly Design: Intuitive, organized, and suitable for both professionals and novices.
How It Works
- Download: Obtain the pre-designed Excel file containing New Pacific Metals Corp.'s (NEWP) financial data.
- Customize: Modify projections, including revenue growth, EBITDA %, and WACC.
- Update Automatically: The intrinsic value and NPV calculations refresh in real-time.
- Test Scenarios: Develop multiple forecasts and evaluate results instantly.
- Make Decisions: Utilize the valuation findings to inform your investment strategy.
Why Choose This Calculator for New Pacific Metals Corp. (NEWP)?
- Accurate Data: Real New Pacific Metals financials ensure reliable valuation results.
- Customizable: Adjust key parameters like growth rates, WACC, and tax rates to align with your projections.
- Time-Saving: Pre-built calculations allow you to avoid starting from scratch.
- Professional-Grade Tool: Tailored for investors, analysts, and consultants in the metals industry.
- User-Friendly: Intuitive design and step-by-step guidance make it accessible for all users.
Who Should Use This Product?
- Investors: Accurately estimate New Pacific Metals Corp.’s (NEWP) fair value before making investment decisions.
- CFOs: Leverage a professional-grade DCF model for financial reporting and analysis specific to New Pacific Metals Corp. (NEWP).
- Consultants: Quickly adapt the template for valuation reports tailored to New Pacific Metals Corp. (NEWP) for clients.
- Entrepreneurs: Gain insights into financial modeling practices used in the mining sector, including New Pacific Metals Corp. (NEWP).
- Educators: Use it as a teaching tool to demonstrate valuation methodologies relevant to companies like New Pacific Metals Corp. (NEWP).
What the Template Contains
- Pre-Filled DCF Model: New Pacific Metals Corp.’s (NEWP) financial data preloaded for immediate use.
- WACC Calculator: Detailed calculations for Weighted Average Cost of Capital.
- Financial Ratios: Evaluate New Pacific Metals Corp.’s (NEWP) profitability, leverage, and efficiency.
- Editable Inputs: Change assumptions such as growth, margins, and CAPEX to fit your scenarios.
- Financial Statements: Annual and quarterly reports to support detailed analysis.
- Interactive Dashboard: Easily visualize key valuation metrics and results.
Disclaimer
All information, articles, and product details provided on this website are for general informational and educational purposes only. We do not claim any ownership over, nor do we intend to infringe upon, any trademarks, copyrights, logos, brand names, or other intellectual property mentioned or depicted on this site. Such intellectual property remains the property of its respective owners, and any references here are made solely for identification or informational purposes, without implying any affiliation, endorsement, or partnership.
We make no representations or warranties, express or implied, regarding the accuracy, completeness, or suitability of any content or products presented. Nothing on this website should be construed as legal, tax, investment, financial, medical, or other professional advice. In addition, no part of this site—including articles or product references—constitutes a solicitation, recommendation, endorsement, advertisement, or offer to buy or sell any securities, franchises, or other financial instruments, particularly in jurisdictions where such activity would be unlawful.
All content is of a general nature and may not address the specific circumstances of any individual or entity. It is not a substitute for professional advice or services. Any actions you take based on the information provided here are strictly at your own risk. You accept full responsibility for any decisions or outcomes arising from your use of this website and agree to release us from any liability in connection with your use of, or reliance upon, the content or products found herein.