
|
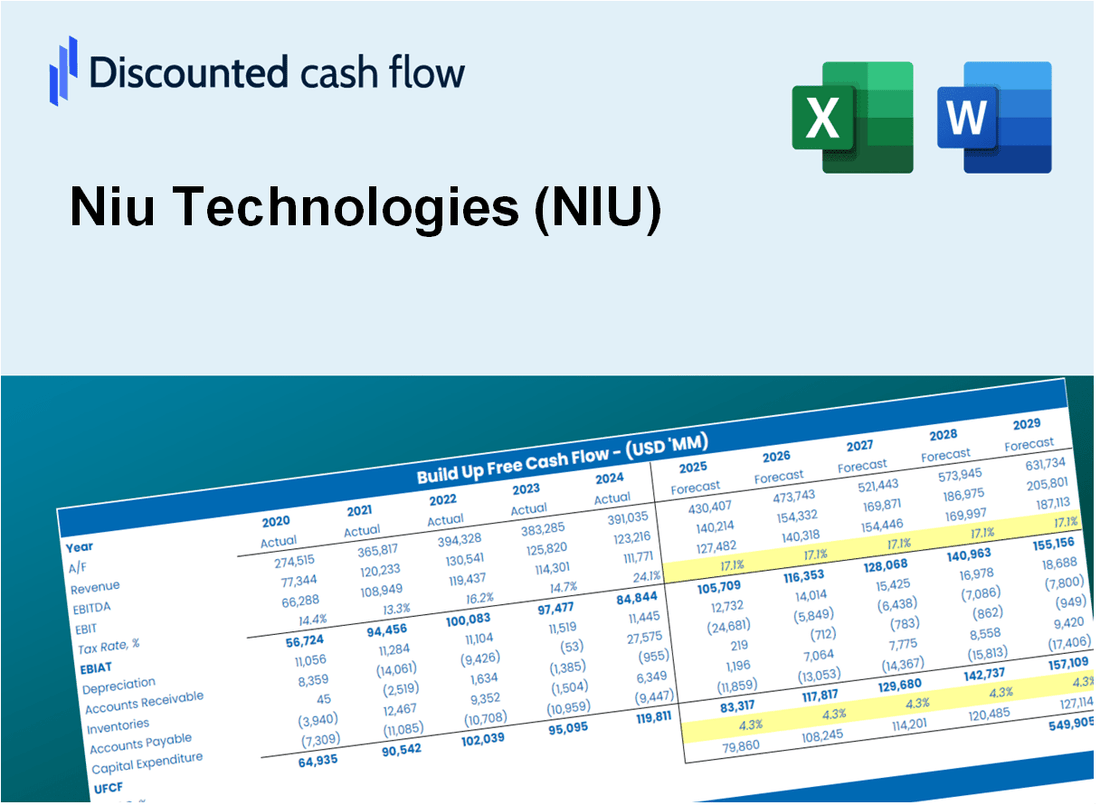
Avaliação DCF da NIU Technologies (NIU) |
Totalmente Editável: Adapte-Se Às Suas Necessidades No Excel Ou Planilhas
Design Profissional: Modelos Confiáveis E Padrão Da Indústria
Pré-Construídos Para Uso Rápido E Eficiente
Compatível com MAC/PC, totalmente desbloqueado
Não É Necessária Experiência; Fácil De Seguir
Niu Technologies (NIU) Bundle
Avalie as perspectivas financeiras da NIU Technologies como um profissional! Esta calculadora DCF (NIU) fornece dados financeiros pré-preenchidos, juntamente com a flexibilidade para modificar o crescimento da receita, o WACC, as margens e outras suposições críticas para se alinhar às suas previsões.
What You Will Get
- Real NIU Financial Data: Pre-filled with Niu Technologies’ historical and projected data for precise analysis.
- Fully Editable Template: Modify key inputs like revenue growth, WACC, and EBITDA % with ease.
- Automatic Calculations: See Niu Technologies’ intrinsic value update instantly based on your changes.
- Professional Valuation Tool: Designed for investors, analysts, and consultants seeking accurate DCF results.
- User-Friendly Design: Simple structure and clear instructions for all experience levels.
Key Features
- 🔍 Real-Life NIU Financials: Pre-filled historical and projected data for Niu Technologies (NIU).
- ✏️ Fully Customizable Inputs: Adjust all critical parameters (yellow cells) like WACC, growth %, and tax rates.
- 📊 Professional DCF Valuation: Built-in formulas calculate Niu’s intrinsic value using the Discounted Cash Flow method.
- ⚡ Instant Results: Visualize Niu’s valuation instantly after making changes.
- Scenario Analysis: Test and compare outcomes for various financial assumptions side-by-side.
How It Works
- Step 1: Download the Excel file for Niu Technologies (NIU).
- Step 2: Examine Niu Technologies' pre-filled financial data and projections.
- Step 3: Adjust key inputs such as revenue growth, WACC, and tax rates (highlighted cells).
- Step 4: Observe the DCF model refresh instantly as you modify your assumptions.
- Step 5: Evaluate the results and leverage the findings for investment strategies.
Why Choose This Calculator for Niu Technologies (NIU)?
- Comprehensive Tool: Combines DCF, WACC, and financial ratio analyses tailored for Niu Technologies.
- Customizable Inputs: Modify the yellow-highlighted cells to explore different financial scenarios for (NIU).
- Detailed Insights: Automatically computes Niu Technologies' intrinsic value and Net Present Value.
- Preloaded Data: Historical and projected data provide reliable starting points for analysis.
- Professional Quality: Perfect for financial analysts, investors, and business consultants focused on (NIU).
Who Should Use Niu Technologies (NIU)?
- Investors: Gain insights and make informed decisions with cutting-edge electric scooter technology.
- Urban Commuters: Experience a convenient and eco-friendly mode of transportation for city travel.
- Dealers: Expand your product offerings with a reliable and innovative electric vehicle brand.
- Tech Enthusiasts: Explore the latest advancements in smart mobility solutions and electric transportation.
- Students and Researchers: Utilize Niu Technologies as a case study in sustainable transportation and business innovation.
What the Template Contains
- Historical Data: Includes Niu Technologies’ (NIU) past financials and baseline forecasts.
- DCF and Levered DCF Models: Detailed templates to calculate Niu Technologies’ (NIU) intrinsic value.
- WACC Sheet: Pre-built calculations for Weighted Average Cost of Capital.
- Editable Inputs: Modify key drivers like growth rates, EBITDA %, and CAPEX assumptions.
- Quarterly and Annual Statements: A complete breakdown of Niu Technologies’ (NIU) financials.
- Interactive Dashboard: Visualize valuation results and projections dynamically.
Disclaimer
All information, articles, and product details provided on this website are for general informational and educational purposes only. We do not claim any ownership over, nor do we intend to infringe upon, any trademarks, copyrights, logos, brand names, or other intellectual property mentioned or depicted on this site. Such intellectual property remains the property of its respective owners, and any references here are made solely for identification or informational purposes, without implying any affiliation, endorsement, or partnership.
We make no representations or warranties, express or implied, regarding the accuracy, completeness, or suitability of any content or products presented. Nothing on this website should be construed as legal, tax, investment, financial, medical, or other professional advice. In addition, no part of this site—including articles or product references—constitutes a solicitation, recommendation, endorsement, advertisement, or offer to buy or sell any securities, franchises, or other financial instruments, particularly in jurisdictions where such activity would be unlawful.
All content is of a general nature and may not address the specific circumstances of any individual or entity. It is not a substitute for professional advice or services. Any actions you take based on the information provided here are strictly at your own risk. You accept full responsibility for any decisions or outcomes arising from your use of this website and agree to release us from any liability in connection with your use of, or reliance upon, the content or products found herein.