
|
NMI Holdings, Inc. (NMIH) Avaliação DCF |
Totalmente Editável: Adapte-Se Às Suas Necessidades No Excel Ou Planilhas
Design Profissional: Modelos Confiáveis E Padrão Da Indústria
Pré-Construídos Para Uso Rápido E Eficiente
Compatível com MAC/PC, totalmente desbloqueado
Não É Necessária Experiência; Fácil De Seguir
NMI Holdings, Inc. (NMIH) Bundle
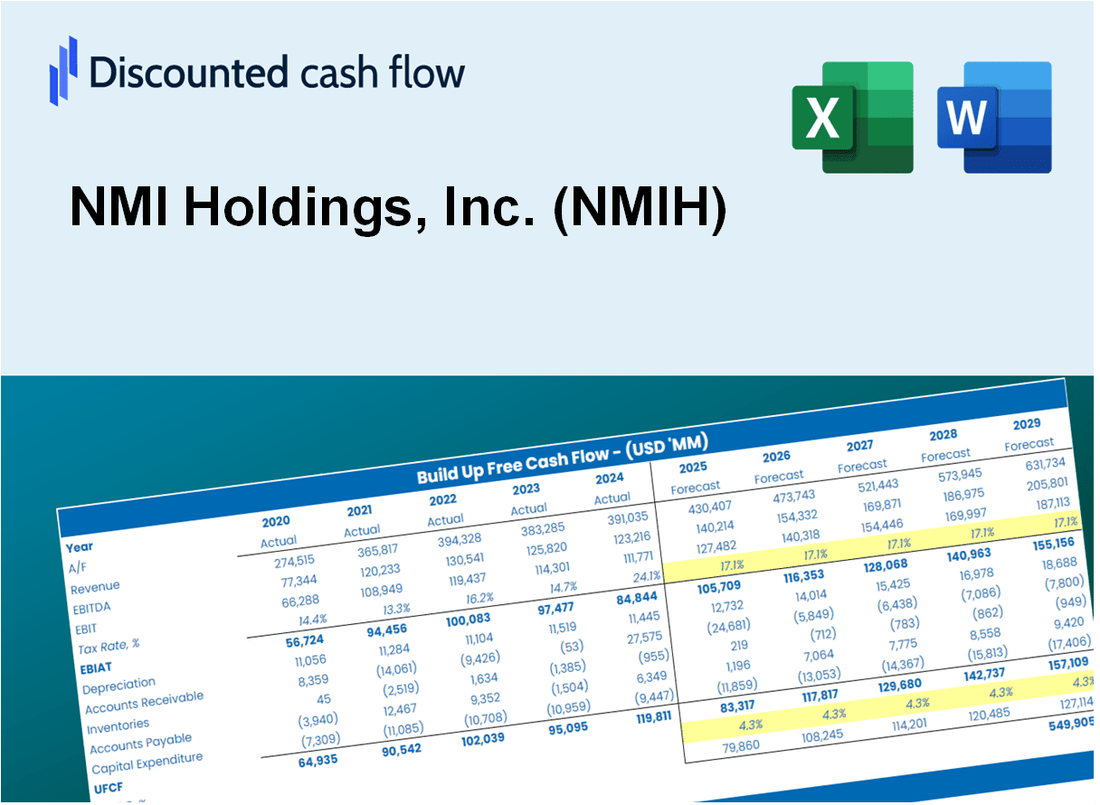
Seja você um investidor ou analista, esta calculadora DCF da NMI Holdings, Inc. (NMIH) é sua ferramenta preferida para uma avaliação precisa. Pré -carregado com dados reais da NMI Holdings, Inc., você pode ajustar as previsões e observar instantaneamente os efeitos.
What You Will Get
- Real NMIH Financial Data: Pre-filled with NMI Holdings' historical and projected data for precise analysis.
- Fully Editable Template: Modify key inputs like revenue growth, WACC, and EBITDA % with ease.
- Automatic Calculations: See NMI Holdings' intrinsic value update instantly based on your changes.
- Professional Valuation Tool: Designed for investors, analysts, and consultants seeking accurate DCF results.
- User-Friendly Design: Simple structure and clear instructions for all experience levels.
Key Features
- 🔍 Real-Life NMIH Financials: Pre-filled historical and projected data for NMI Holdings, Inc.
- ✏️ Fully Customizable Inputs: Adjust all critical parameters (yellow cells) like WACC, growth %, and tax rates.
- 📊 Professional DCF Valuation: Built-in formulas calculate NMIH’s intrinsic value using the Discounted Cash Flow method.
- ⚡ Instant Results: Visualize NMIH’s valuation instantly after making changes.
- Scenario Analysis: Test and compare outcomes for various financial assumptions side-by-side.
How It Works
- Step 1: Download the Excel file.
- Step 2: Review pre-entered NMI Holdings, Inc. (NMIH) data (historical and projected).
- Step 3: Adjust key assumptions (yellow cells) based on your analysis.
- Step 4: View automatic recalculations for NMI Holdings, Inc. (NMIH)’s intrinsic value.
- Step 5: Use the outputs for investment decisions or reporting.
Why Choose This Calculator for NMI Holdings, Inc. (NMIH)?
- All-in-One Solution: Features DCF, WACC, and financial ratio analyses tailored for NMIH.
- Flexible Inputs: Modify the highlighted fields to explore different financial scenarios for NMI Holdings.
- In-Depth Analysis: Automatically computes NMIH’s intrinsic value and Net Present Value.
- Preloaded Information: Access to historical and projected data for precise calculations.
- High-Quality Standards: Perfect for financial analysts, investors, and business advisors focusing on NMIH.
Who Should Use This Product?
- Professional Investors: Develop comprehensive and accurate valuation models for analyzing NMI Holdings, Inc. (NMIH).
- Corporate Finance Teams: Evaluate valuation scenarios to inform strategic decisions within the organization.
- Consultants and Advisors: Deliver precise valuation insights for clients interested in NMI Holdings, Inc. (NMIH).
- Students and Educators: Utilize real-world data to enhance learning and practice in financial modeling.
- Real Estate Professionals: Gain insights into how companies like NMI Holdings, Inc. (NMIH) are valued in the mortgage insurance market.
What the Template Contains
- Pre-Filled Data: Includes NMI Holdings, Inc.'s historical financials and forecasts.
- Discounted Cash Flow Model: Editable DCF valuation model with automatic calculations.
- Weighted Average Cost of Capital (WACC): A dedicated sheet for calculating WACC based on custom inputs.
- Key Financial Ratios: Analyze NMI Holdings, Inc.'s profitability, efficiency, and leverage.
- Customizable Inputs: Edit revenue growth, margins, and tax rates with ease.
- Clear Dashboard: Charts and tables summarizing key valuation results.
Disclaimer
All information, articles, and product details provided on this website are for general informational and educational purposes only. We do not claim any ownership over, nor do we intend to infringe upon, any trademarks, copyrights, logos, brand names, or other intellectual property mentioned or depicted on this site. Such intellectual property remains the property of its respective owners, and any references here are made solely for identification or informational purposes, without implying any affiliation, endorsement, or partnership.
We make no representations or warranties, express or implied, regarding the accuracy, completeness, or suitability of any content or products presented. Nothing on this website should be construed as legal, tax, investment, financial, medical, or other professional advice. In addition, no part of this site—including articles or product references—constitutes a solicitation, recommendation, endorsement, advertisement, or offer to buy or sell any securities, franchises, or other financial instruments, particularly in jurisdictions where such activity would be unlawful.
All content is of a general nature and may not address the specific circumstances of any individual or entity. It is not a substitute for professional advice or services. Any actions you take based on the information provided here are strictly at your own risk. You accept full responsibility for any decisions or outcomes arising from your use of this website and agree to release us from any liability in connection with your use of, or reliance upon, the content or products found herein.