|
Nomura Holdings, Inc. (RMN) DCF Avaliação |
Totalmente Editável: Adapte-Se Às Suas Necessidades No Excel Ou Planilhas
Design Profissional: Modelos Confiáveis E Padrão Da Indústria
Pré-Construídos Para Uso Rápido E Eficiente
Compatível com MAC/PC, totalmente desbloqueado
Não É Necessária Experiência; Fácil De Seguir
Nomura Holdings, Inc. (NMR) Bundle
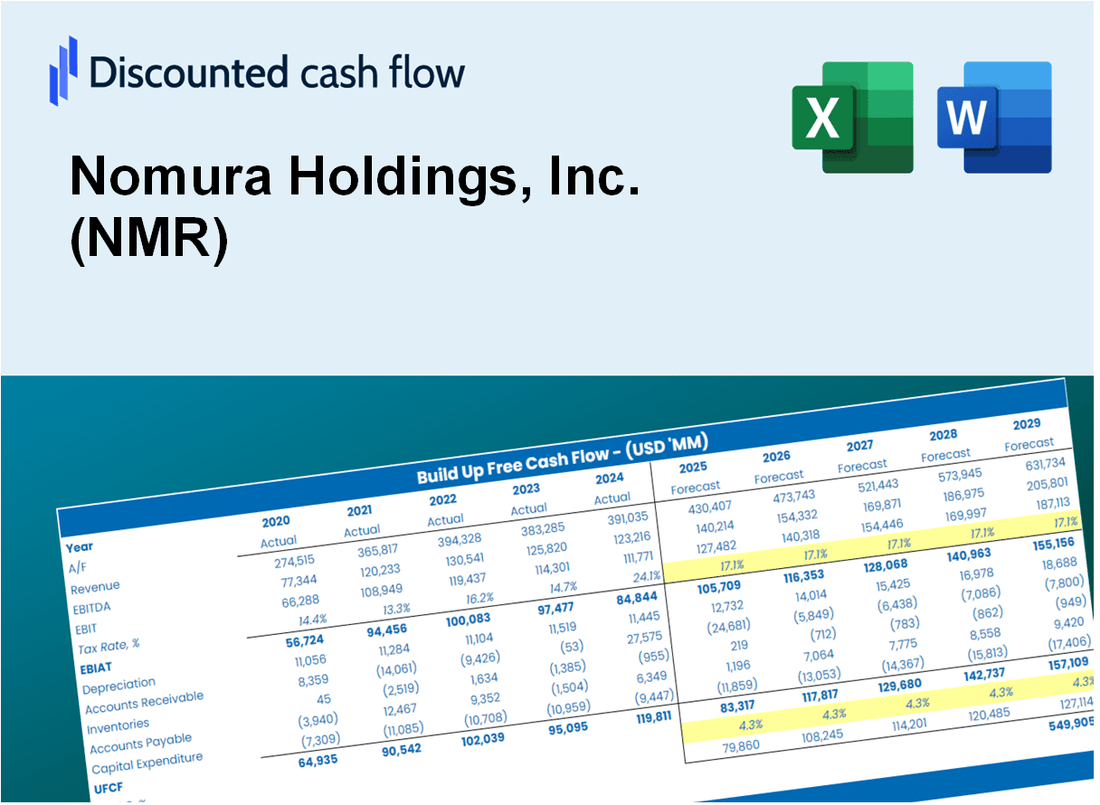
Obtenha informações sobre sua análise de avaliação da Nomura Holdings, Inc. (RMN) com nossa calculadora DCF de última geração! Com dados reais (RMN) internos, este modelo Excel permite ajustar as previsões e suposições para um cálculo preciso do valor intrínseco da Nomura Holdings, Inc.
Discounted Cash Flow (DCF) - (USD MM)
| Year | AY1 2021 |
AY2 2022 |
AY3 2023 |
AY4 2024 |
AY5 2025 |
FY1 2026 |
FY2 2027 |
FY3 2028 |
FY4 2029 |
FY5 2030 |
|---|---|---|---|---|---|---|---|---|---|---|
| Revenue | 9,130.1 | 8,869.8 | 14,824.4 | 25,652.8 | 29,096.1 | 40,061.6 | 55,159.8 | 75,948.0 | 104,570.8 | 143,980.8 |
| Revenue Growth, % | 0 | -2.85 | 67.13 | 73.04 | 13.42 | 37.69 | 37.69 | 37.69 | 37.69 | 37.69 |
| EBITDA | 1,901.5 | 1,847.4 | 1,361.6 | .0 | 3,445.2 | 5,022.2 | 6,914.9 | 9,520.9 | 13,109.1 | 18,049.6 |
| EBITDA, % | 20.83 | 20.83 | 9.18 | 0 | 11.84 | 12.54 | 12.54 | 12.54 | 12.54 | 12.54 |
| Depreciation | 412.2 | 384.3 | 396.6 | 396.0 | 398.0 | 1,156.5 | 1,592.4 | 2,192.5 | 3,018.9 | 4,156.6 |
| Depreciation, % | 4.51 | 4.33 | 2.68 | 1.54 | 1.37 | 2.89 | 2.89 | 2.89 | 2.89 | 2.89 |
| EBIT | 1,489.3 | 1,463.1 | 965.0 | -396.0 | 3,047.1 | 3,865.6 | 5,322.5 | 7,328.4 | 10,090.3 | 13,893.0 |
| EBIT, % | 16.31 | 16.5 | 6.51 | -1.54 | 10.47 | 9.65 | 9.65 | 9.65 | 9.65 | 9.65 |
| Total Cash | 26,888.7 | 23,481.4 | 29,190.4 | 30,894.6 | 35,604.4 | 40,061.6 | 55,159.8 | 75,948.0 | 104,570.8 | 143,980.8 |
| Total Cash, percent | .0 | .0 | .0 | .0 | .0 | .0 | .0 | .0 | .0 | .0 |
| Account Receivables | 8,059.0 | 11,063.1 | 9,659.3 | 10,869.2 | 10,594.5 | 26,617.6 | 36,649.1 | 50,461.2 | 69,478.7 | 95,663.4 |
| Account Receivables, % | 88.27 | 124.73 | 65.16 | 42.37 | 36.41 | 66.44 | 66.44 | 66.44 | 66.44 | 66.44 |
| Inventories | .0 | 55,777.4 | 60,927.6 | .0 | .0 | 16,024.6 | 22,063.9 | 30,379.2 | 41,828.3 | 57,592.3 |
| Inventories, % | 0 | 628.85 | 411 | 0 | 0 | 40 | 40 | 40 | 40 | 40 |
| Accounts Payable | 9,392.3 | 9,832.7 | 8,780.2 | 8,463.1 | 8,891.7 | 25,862.1 | 35,608.8 | 49,028.8 | 67,506.5 | 92,947.9 |
| Accounts Payable, % | 102.87 | 110.86 | 59.23 | 32.99 | 30.56 | 64.56 | 64.56 | 64.56 | 64.56 | 64.56 |
| Capital Expenditure | -773.9 | -718.8 | -1,105.1 | -941.2 | -1,226.5 | -2,557.5 | -3,521.4 | -4,848.5 | -6,675.7 | -9,191.6 |
| Capital Expenditure, % | -8.48 | -8.1 | -7.45 | -3.67 | -4.22 | -6.38 | -6.38 | -6.38 | -6.38 | -6.38 |
| Tax Rate, % | 27.8 | 27.8 | 27.8 | 27.8 | 27.8 | 27.8 | 27.8 | 27.8 | 27.8 | 27.8 |
| EBITAT | 988.6 | 923.2 | 599.1 | -239.9 | 2,199.9 | 2,507.4 | 3,452.3 | 4,753.4 | 6,544.9 | 9,011.4 |
| Depreciation | ||||||||||
| Changes in Account Receivables | ||||||||||
| Changes in Inventories | ||||||||||
| Changes in Accounts Payable | ||||||||||
| Capital Expenditure | ||||||||||
| UFCF | 1,960.1 | -57,752.4 | -4,908.3 | 58,615.5 | 2,074.8 | -13,971.1 | -4,800.6 | -6,609.9 | -9,100.9 | -12,530.9 |
| WACC, % | 6.01 | 5.74 | 5.66 | 5.53 | 6.48 | 5.88 | 5.88 | 5.88 | 5.88 | 5.88 |
| PV UFCF | ||||||||||
| SUM PV UFCF | -39,701.5 | |||||||||
| Long Term Growth Rate, % | 2.00 | |||||||||
| Free cash flow (T + 1) | -12,781 | |||||||||
| Terminal Value | -329,181 | |||||||||
| Present Terminal Value | -247,347 | |||||||||
| Enterprise Value | -287,049 | |||||||||
| Net Debt | 166,776 | |||||||||
| Equity Value | -453,825 | |||||||||
| Diluted Shares Outstanding, MM | 3,066 | |||||||||
| Equity Value Per Share | -148.00 |
What You Will Get
- Real NMR Financial Data: Pre-filled with Nomura Holdings’ historical and projected data for precise analysis.
- Fully Editable Template: Modify key inputs like revenue growth, WACC, and EBITDA % with ease.
- Automatic Calculations: See Nomura Holdings’ intrinsic value update instantly based on your changes.
- Professional Valuation Tool: Designed for investors, analysts, and consultants seeking accurate DCF results.
- User-Friendly Design: Simple structure and clear instructions for all experience levels.
Key Features
- Pre-Loaded Data: Nomura Holdings, Inc.’s historical financial statements and pre-filled forecasts.
- Fully Adjustable Inputs: Modify WACC, tax rates, revenue growth, and EBITDA margins as needed.
- Instant Results: Observe Nomura’s intrinsic value recalculating in real time.
- Clear Visual Outputs: Dashboard charts showcase valuation results and essential metrics.
- Built for Accuracy: A professional tool tailored for analysts, investors, and finance experts.
How It Works
- Download the Template: Gain immediate access to the Excel-based NMR DCF Calculator.
- Input Your Assumptions: Modify the yellow-highlighted cells for growth rates, WACC, margins, and additional variables.
- Instant Calculations: The model automatically recalculates Nomura’s intrinsic value.
- Test Scenarios: Experiment with various assumptions to assess potential valuation shifts.
- Analyze and Decide: Utilize the results to inform your investment or financial analysis.
Why Choose This Calculator for Nomura Holdings, Inc. (NMR)?
- Accurate Data: Up-to-date Nomura financials provide trustworthy valuation results.
- Customizable: Modify essential parameters such as growth rates, WACC, and tax rates to align with your forecasts.
- Time-Saving: Pre-configured calculations save you the hassle of starting from the ground up.
- Professional-Grade Tool: Tailored for investors, analysts, and financial consultants.
- User-Friendly: Easy-to-navigate layout and clear instructions make it accessible for all users.
Who Should Use This Product?
- Professional Investors: Develop comprehensive and accurate valuation models for analyzing portfolios involving Nomura Holdings, Inc. (NMR).
- Corporate Finance Teams: Evaluate valuation scenarios to inform strategic decisions within their organizations.
- Consultants and Advisors: Equip clients with precise valuation insights regarding Nomura Holdings, Inc. (NMR).
- Students and Educators: Utilize real-world data to enhance learning and practice in financial modeling.
- Finance Enthusiasts: Gain insights into how financial institutions like Nomura Holdings, Inc. (NMR) are valued in the market.
What the Template Contains
- Comprehensive DCF Model: Editable template with detailed valuation calculations for Nomura Holdings, Inc. (NMR).
- Real-World Data: Nomura’s historical and projected financials preloaded for analysis.
- Customizable Parameters: Adjust WACC, growth rates, and tax assumptions to test various scenarios.
- Financial Statements: Complete annual and quarterly breakdowns for deeper insights into Nomura's performance.
- Key Ratios: Built-in analysis for profitability, efficiency, and leverage metrics.
- Dashboard with Visual Outputs: Charts and tables designed for clear, actionable results.
Disclaimer
All information, articles, and product details provided on this website are for general informational and educational purposes only. We do not claim any ownership over, nor do we intend to infringe upon, any trademarks, copyrights, logos, brand names, or other intellectual property mentioned or depicted on this site. Such intellectual property remains the property of its respective owners, and any references here are made solely for identification or informational purposes, without implying any affiliation, endorsement, or partnership.
We make no representations or warranties, express or implied, regarding the accuracy, completeness, or suitability of any content or products presented. Nothing on this website should be construed as legal, tax, investment, financial, medical, or other professional advice. In addition, no part of this site—including articles or product references—constitutes a solicitation, recommendation, endorsement, advertisement, or offer to buy or sell any securities, franchises, or other financial instruments, particularly in jurisdictions where such activity would be unlawful.
All content is of a general nature and may not address the specific circumstances of any individual or entity. It is not a substitute for professional advice or services. Any actions you take based on the information provided here are strictly at your own risk. You accept full responsibility for any decisions or outcomes arising from your use of this website and agree to release us from any liability in connection with your use of, or reliance upon, the content or products found herein.