
|
Northern Oil and Gas, Inc. (NOG) Avaliação DCF |
Totalmente Editável: Adapte-Se Às Suas Necessidades No Excel Ou Planilhas
Design Profissional: Modelos Confiáveis E Padrão Da Indústria
Pré-Construídos Para Uso Rápido E Eficiente
Compatível com MAC/PC, totalmente desbloqueado
Não É Necessária Experiência; Fácil De Seguir
Northern Oil and Gas, Inc. (NOG) Bundle
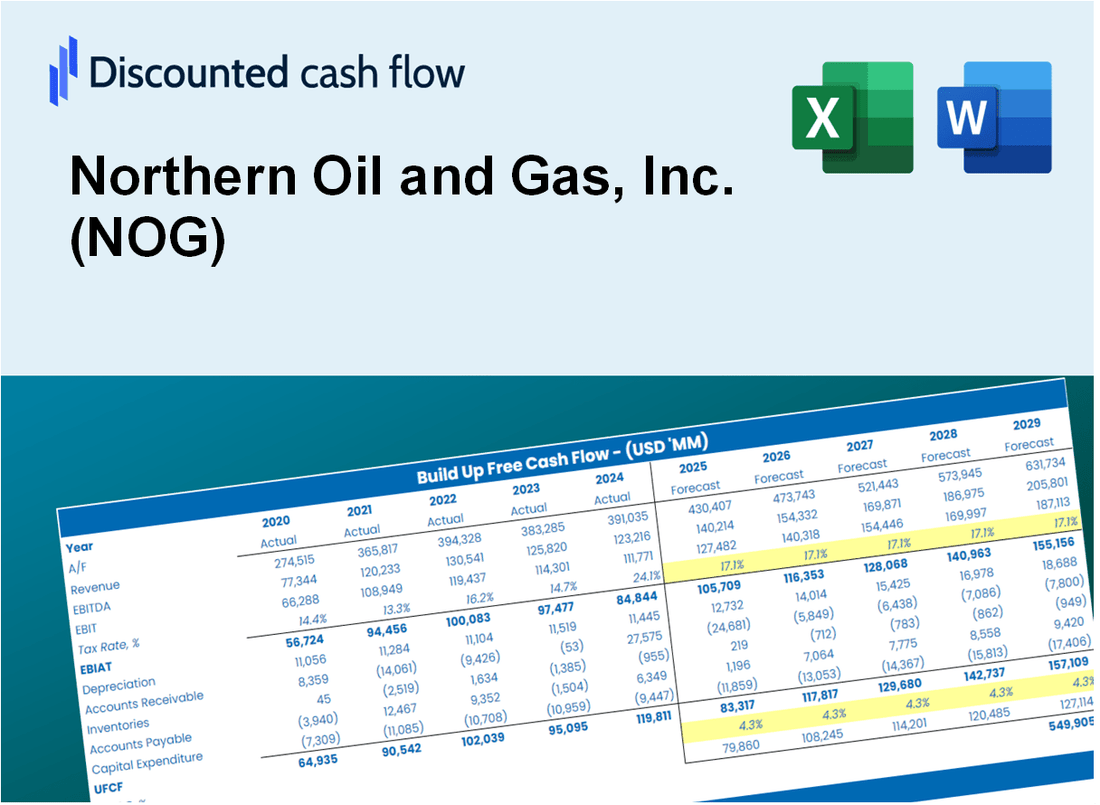
Obtenha informações sobre sua análise de avaliação do Northern Oil and Gas, Inc. (NOG) com nossa sofisticada calculadora DCF! Este modelo do Excel é pré -carregado com dados reais (NOG), permitindo que você ajuste as previsões e suposições para determinar com precisão o valor intrínseco do Northern Oil and Gas, Inc.
Discounted Cash Flow (DCF) - (USD MM)
| Year | AY1 2020 |
AY2 2021 |
AY3 2022 |
AY4 2023 |
AY5 2024 |
FY1 2025 |
FY2 2026 |
FY3 2027 |
FY4 2028 |
FY5 2029 |
|---|---|---|---|---|---|---|---|---|---|---|
| Revenue | 324.1 | 975.1 | 1,985.8 | 1,907.0 | 2,163.8 | 3,297.0 | 5,023.8 | 7,654.9 | 11,664.1 | 17,773.1 |
| Revenue Growth, % | 0 | 200.89 | 103.65 | -3.97 | 13.46 | 52.37 | 52.37 | 52.37 | 52.37 | 52.37 |
| EBITDA | -685.6 | 206.4 | 1,107.9 | 1,622.4 | 1,579.4 | 890.4 | 1,356.8 | 2,067.4 | 3,150.2 | 4,800.1 |
| EBITDA, % | -211.55 | 21.17 | 55.79 | 85.08 | 72.99 | 27.01 | 27.01 | 27.01 | 27.01 | 27.01 |
| Depreciation | 162.1 | 140.8 | 251.3 | 486.0 | 740.9 | 902.4 | 1,375.0 | 2,095.2 | 3,192.5 | 4,864.5 |
| Depreciation, % | 50.03 | 14.44 | 12.65 | 25.49 | 34.24 | 27.37 | 27.37 | 27.37 | 27.37 | 27.37 |
| EBIT | -847.7 | 65.6 | 856.7 | 1,136.4 | 838.5 | 317.9 | 484.4 | 738.1 | 1,124.7 | 1,713.8 |
| EBIT, % | -261.58 | 6.73 | 43.14 | 59.59 | 38.75 | 9.64 | 9.64 | 9.64 | 9.64 | 9.64 |
| Total Cash | 1.4 | 9.5 | 2.5 | 8.2 | 8.9 | 15.7 | 24.0 | 36.5 | 55.7 | 84.8 |
| Total Cash, percent | .0 | .0 | .0 | .0 | .0 | .0 | .0 | .0 | .0 | .0 |
| Account Receivables | 71.0 | 193.6 | 271.7 | 373.8 | 427.7 | 625.2 | 952.6 | 1,451.6 | 2,211.8 | 3,370.2 |
| Account Receivables, % | 21.91 | 19.85 | 13.68 | 19.6 | 19.77 | 18.96 | 18.96 | 18.96 | 18.96 | 18.96 |
| Inventories | .0 | .0 | .0 | .0 | .0 | .0 | .0 | .0 | .0 | .0 |
| Inventories, % | 0 | 0 | 0 | 0 | 0 | 0 | 0 | 0 | 0 | 0 |
| Accounts Payable | 35.8 | 65.5 | 128.6 | 192.7 | 202.9 | 288.3 | 439.2 | 669.3 | 1,019.8 | 1,553.9 |
| Accounts Payable, % | 11.05 | 6.71 | 6.48 | 10.1 | 9.38 | 8.74 | 8.74 | 8.74 | 8.74 | 8.74 |
| Capital Expenditure | -283.9 | -593.8 | -1,359.8 | -1,845.3 | -1,691.8 | -2,584.4 | -3,938.0 | -6,000.5 | -9,143.2 | -13,931.8 |
| Capital Expenditure, % | -87.61 | -60.9 | -68.48 | -96.76 | -78.19 | -78.39 | -78.39 | -78.39 | -78.39 | -78.39 |
| Tax Rate, % | 23.58 | 23.58 | 23.58 | 23.58 | 23.58 | 23.58 | 23.58 | 23.58 | 23.58 | 23.58 |
| EBITAT | -847.5 | 63.3 | 853.2 | 1,048.1 | 640.8 | 295.5 | 450.2 | 686.0 | 1,045.3 | 1,592.8 |
| Depreciation | ||||||||||
| Changes in Account Receivables | ||||||||||
| Changes in Inventories | ||||||||||
| Changes in Accounts Payable | ||||||||||
| Capital Expenditure | ||||||||||
| UFCF | -1,004.6 | -482.5 | -270.3 | -349.2 | -353.9 | -1,498.6 | -2,289.2 | -3,488.2 | -5,315.1 | -8,098.8 |
| WACC, % | 7.68 | 7.56 | 7.66 | 7.41 | 6.87 | 7.44 | 7.44 | 7.44 | 7.44 | 7.44 |
| PV UFCF | ||||||||||
| SUM PV UFCF | -15,838.0 | |||||||||
| Long Term Growth Rate, % | 0.50 | |||||||||
| Free cash flow (T + 1) | -8,139 | |||||||||
| Terminal Value | -117,328 | |||||||||
| Present Terminal Value | -81,965 | |||||||||
| Enterprise Value | -97,803 | |||||||||
| Net Debt | 2,360 | |||||||||
| Equity Value | -100,164 | |||||||||
| Diluted Shares Outstanding, MM | 101 | |||||||||
| Equity Value Per Share | -989.09 |
What You Will Get
- Comprehensive NOG Financials: Access to historical and projected data for precise valuation.
- Customizable Inputs: Adjust WACC, tax rates, revenue growth, and capital expenditures as needed.
- Dynamic Calculations: Intrinsic value and NPV are computed in real-time.
- Scenario Simulation: Evaluate various scenarios to assess Northern Oil and Gas’s future potential.
- User-Friendly Interface: Designed for industry experts while remaining approachable for newcomers.
Key Features
- Customizable Forecast Inputs: Adjust essential parameters such as production growth, operating margin, and capital investments.
- Instant DCF Valuation: Quickly computes intrinsic value, NPV, and additional financial metrics.
- High-Precision Accuracy: Leverages Northern Oil and Gas, Inc.'s (NOG) actual financial data for reliable valuation results.
- Simplified Scenario Analysis: Effortlessly evaluate various assumptions and analyze different outcomes.
- Efficiency Booster: Streamlines the valuation process, removing the need for complex model creation from the ground up.
How It Works
- Download the Template: Get instant access to the Excel-based NOG DCF Calculator.
- Input Your Assumptions: Adjust yellow-highlighted cells for growth rates, WACC, margins, and more.
- Instant Calculations: The model automatically updates Northern Oil and Gas, Inc.'s intrinsic value.
- Test Scenarios: Simulate different assumptions to evaluate potential valuation changes.
- Analyze and Decide: Use the results to guide your investment or financial analysis.
Why Choose This Calculator for Northern Oil and Gas, Inc. (NOG)?
- User-Friendly Interface: Perfect for both novices and seasoned professionals.
- Customizable Inputs: Adjust parameters effortlessly to suit your analysis needs.
- Real-Time Valuation: Monitor immediate changes to Northern Oil and Gas’s valuation as you tweak inputs.
- Preloaded Data: Comes with Northern Oil and Gas’s actual financial metrics for swift assessments.
- Relied Upon by Experts: A go-to tool for investors and analysts aiming for informed decisions.
Who Should Use This Product?
- Investors: Evaluate Northern Oil and Gas, Inc. (NOG)'s performance before making investment decisions.
- CFOs and Financial Analysts: Optimize valuation methodologies and assess financial projections for NOG.
- Startup Founders: Understand the valuation metrics used for companies like Northern Oil and Gas, Inc. (NOG).
- Consultants: Provide comprehensive valuation analyses and reports for clients in the oil and gas sector.
- Students and Educators: Utilize current data from Northern Oil and Gas, Inc. (NOG) to learn and teach valuation strategies.
What the Template Contains
- Pre-Filled Data: Includes Northern Oil and Gas, Inc.'s (NOG) historical financials and forecasts.
- Discounted Cash Flow Model: Editable DCF valuation model with automatic calculations tailored for (NOG).
- Weighted Average Cost of Capital (WACC): A dedicated sheet for calculating WACC based on custom inputs relevant to (NOG).
- Key Financial Ratios: Analyze Northern Oil and Gas, Inc.'s (NOG) profitability, efficiency, and leverage.
- Customizable Inputs: Edit revenue growth, margins, and tax rates specific to (NOG) with ease.
- Clear Dashboard: Charts and tables summarizing key valuation results for (NOG).
Disclaimer
All information, articles, and product details provided on this website are for general informational and educational purposes only. We do not claim any ownership over, nor do we intend to infringe upon, any trademarks, copyrights, logos, brand names, or other intellectual property mentioned or depicted on this site. Such intellectual property remains the property of its respective owners, and any references here are made solely for identification or informational purposes, without implying any affiliation, endorsement, or partnership.
We make no representations or warranties, express or implied, regarding the accuracy, completeness, or suitability of any content or products presented. Nothing on this website should be construed as legal, tax, investment, financial, medical, or other professional advice. In addition, no part of this site—including articles or product references—constitutes a solicitation, recommendation, endorsement, advertisement, or offer to buy or sell any securities, franchises, or other financial instruments, particularly in jurisdictions where such activity would be unlawful.
All content is of a general nature and may not address the specific circumstances of any individual or entity. It is not a substitute for professional advice or services. Any actions you take based on the information provided here are strictly at your own risk. You accept full responsibility for any decisions or outcomes arising from your use of this website and agree to release us from any liability in connection with your use of, or reliance upon, the content or products found herein.