
|
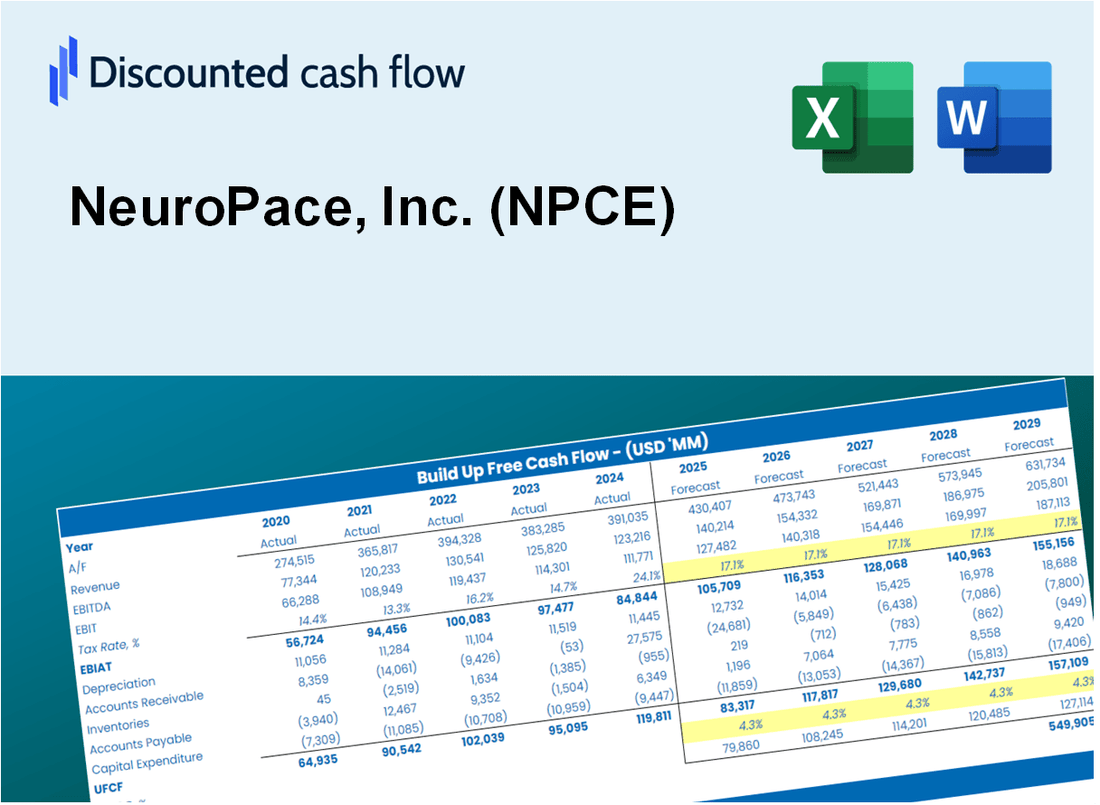
Avaliação DCF Neuropace, Inc. (NPCE) |
Totalmente Editável: Adapte-Se Às Suas Necessidades No Excel Ou Planilhas
Design Profissional: Modelos Confiáveis E Padrão Da Indústria
Pré-Construídos Para Uso Rápido E Eficiente
Compatível com MAC/PC, totalmente desbloqueado
Não É Necessária Experiência; Fácil De Seguir
NeuroPace, Inc. (NPCE) Bundle
Simplifique a avaliação Neuropace, Inc. (NPCE) com esta calculadora DCF personalizável! Apresentando o Real Neuropace, Inc. (NPCE) e os insumos de previsão ajustável, você pode testar cenários e descobrir o valor justo da Neuropace, Inc. (NPCE) em minutos.
Discounted Cash Flow (DCF) - (USD MM)
| Year | AY1 2020 |
AY2 2021 |
AY3 2022 |
AY4 2023 |
AY5 2024 |
FY1 2025 |
FY2 2026 |
FY3 2027 |
FY4 2028 |
FY5 2029 |
|---|---|---|---|---|---|---|---|---|---|---|
| Revenue | 41.1 | 45.2 | 45.5 | 65.4 | 79.9 | 95.2 | 113.4 | 135.0 | 160.8 | 191.6 |
| Revenue Growth, % | 0 | 9.83 | 0.74586 | 43.72 | 22.14 | 19.11 | 19.11 | 19.11 | 19.11 | 19.11 |
| EBITDA | -12.5 | -28.4 | -36.6 | -22.8 | -16.6 | -43.6 | -51.9 | -61.9 | -73.7 | -87.8 |
| EBITDA, % | -30.34 | -62.8 | -80.33 | -34.9 | -20.74 | -45.82 | -45.82 | -45.82 | -45.82 | -45.82 |
| Depreciation | .3 | .3 | 3.0 | 1.6 | 1.8 | 2.4 | 2.9 | 3.4 | 4.1 | 4.8 |
| Depreciation, % | 0.75842 | 0.65511 | 6.56 | 2.45 | 2.21 | 2.53 | 2.53 | 2.53 | 2.53 | 2.53 |
| EBIT | -12.8 | -28.7 | -39.6 | -24.4 | -18.3 | -46.0 | -54.8 | -65.3 | -77.8 | -92.6 |
| EBIT, % | -31.1 | -63.45 | -86.89 | -37.36 | -22.96 | -48.35 | -48.35 | -48.35 | -48.35 | -48.35 |
| Total Cash | 38.1 | 115.6 | 77.4 | 66.5 | 52.8 | 87.3 | 104.0 | 123.8 | 147.5 | 175.7 |
| Total Cash, percent | .0 | .0 | .0 | .0 | .0 | .0 | .0 | .0 | .0 | .0 |
| Account Receivables | 8.4 | 7.1 | 7.5 | 12.3 | 12.9 | 16.6 | 19.8 | 23.6 | 28.1 | 33.5 |
| Account Receivables, % | 20.41 | 15.69 | 16.44 | 18.82 | 16.08 | 17.49 | 17.49 | 17.49 | 17.49 | 17.49 |
| Inventories | 6.9 | 7.8 | 9.7 | 11.2 | 13.4 | 17.0 | 20.3 | 24.1 | 28.7 | 34.2 |
| Inventories, % | 16.79 | 17.31 | 21.34 | 17.14 | 16.75 | 17.87 | 17.87 | 17.87 | 17.87 | 17.87 |
| Accounts Payable | .9 | 1.4 | 2.1 | 2.3 | 3.0 | 3.3 | 3.9 | 4.7 | 5.6 | 6.6 |
| Accounts Payable, % | 2.31 | 3.05 | 4.72 | 3.56 | 3.7 | 3.47 | 3.47 | 3.47 | 3.47 | 3.47 |
| Capital Expenditure | -.1 | -.4 | -.6 | -.2 | -.3 | -.6 | -.7 | -.8 | -1.0 | -1.1 |
| Capital Expenditure, % | -0.15071 | -0.84988 | -1.32 | -0.26444 | -0.38295 | -0.59453 | -0.59453 | -0.59453 | -0.59453 | -0.59453 |
| Tax Rate, % | 0 | 0 | 0 | 0 | 0 | 0 | 0 | 0 | 0 | 0 |
| EBITAT | -12.8 | -28.7 | -39.6 | -24.4 | -18.3 | -46.0 | -54.8 | -65.3 | -77.8 | -92.6 |
| Depreciation | ||||||||||
| Changes in Account Receivables | ||||||||||
| Changes in Inventories | ||||||||||
| Changes in Accounts Payable | ||||||||||
| Capital Expenditure | ||||||||||
| UFCF | -26.9 | -27.9 | -38.7 | -29.2 | -19.0 | -51.2 | -58.4 | -69.6 | -82.9 | -98.7 |
| WACC, % | 12.61 | 12.61 | 12.61 | 12.61 | 12.61 | 12.61 | 12.61 | 12.61 | 12.61 | 12.61 |
| PV UFCF | ||||||||||
| SUM PV UFCF | -246.4 | |||||||||
| Long Term Growth Rate, % | 2.00 | |||||||||
| Free cash flow (T + 1) | -101 | |||||||||
| Terminal Value | -949 | |||||||||
| Present Terminal Value | -524 | |||||||||
| Enterprise Value | -771 | |||||||||
| Net Debt | 60 | |||||||||
| Equity Value | -831 | |||||||||
| Diluted Shares Outstanding, MM | 29 | |||||||||
| Equity Value Per Share | -28.51 |
What You Will Get
- Comprehensive NPCE Financials: Access to historical and projected data for precise valuation.
- Customizable Inputs: Adjust WACC, tax rates, revenue growth, and capital expenditures as needed.
- Real-Time Calculations: Intrinsic value and NPV are computed automatically.
- Scenario Analysis: Evaluate various scenarios to assess NeuroPace's future performance.
- User-Friendly Interface: Designed for professionals while remaining easy to navigate for newcomers.
Key Features
- 🔍 Real-Life NPCE Financials: Pre-filled historical and projected data for NeuroPace, Inc.
- ✏️ Fully Customizable Inputs: Adjust all critical parameters (yellow cells) like WACC, growth %, and tax rates.
- 📊 Professional DCF Valuation: Built-in formulas calculate NeuroPace’s intrinsic value using the Discounted Cash Flow method.
- ⚡ Instant Results: Visualize NeuroPace’s valuation instantly after making changes.
- Scenario Analysis: Test and compare outcomes for various financial assumptions side-by-side.
How It Works
- Download: Obtain the pre-formatted Excel file containing NeuroPace, Inc.'s (NPCE) financial data.
- Customize: Modify projections, including revenue growth, EBITDA %, and WACC to fit your analysis.
- Update Automatically: The intrinsic value and NPV calculations refresh in real-time.
- Test Scenarios: Develop various projections and instantly compare the results.
- Make Decisions: Leverage the valuation outcomes to inform your investment strategies.
Why Choose NeuroPace, Inc. (NPCE)?
- Innovative Solutions: Cutting-edge technology designed to improve patient outcomes.
- Proven Effectiveness: Clinical studies demonstrate significant benefits for epilepsy patients.
- Patient-Centric Approach: Tailored treatments that focus on individual needs and lifestyles.
- Expert Support: Dedicated team of professionals providing guidance and assistance.
- Industry Recognition: Trusted by healthcare providers and patients alike for quality and reliability.
Who Should Use NeuroPace, Inc. (NPCE)?
- Investors: Gain insights into innovative technologies and make informed investment choices.
- Healthcare Professionals: Understand the benefits of neuromodulation therapies for patient care.
- Researchers: Explore cutting-edge clinical data and advancements in neurological treatments.
- Patients and Caregivers: Learn about options for managing epilepsy and improving quality of life.
- Educators and Students: Utilize resources to enhance knowledge in medical technology and neuroscience.
What the Template Contains
- Operating and Balance Sheet Data: Pre-filled NeuroPace, Inc. (NPCE) historical data and forecasts, including revenue, EBITDA, EBIT, and capital expenditures.
- WACC Calculation: A dedicated sheet for Weighted Average Cost of Capital (WACC), including parameters like Beta, risk-free rate, and share price.
- DCF Valuation (Unlevered and Levered): Editable Discounted Cash Flow models showing intrinsic value with detailed calculations.
- Financial Statements: Pre-loaded financial statements (annual and quarterly) to support analysis.
- Key Ratios: Includes profitability, leverage, and efficiency ratios for NeuroPace, Inc. (NPCE).
- Dashboard and Charts: Visual summary of valuation outputs and assumptions to analyze results easily.
Disclaimer
All information, articles, and product details provided on this website are for general informational and educational purposes only. We do not claim any ownership over, nor do we intend to infringe upon, any trademarks, copyrights, logos, brand names, or other intellectual property mentioned or depicted on this site. Such intellectual property remains the property of its respective owners, and any references here are made solely for identification or informational purposes, without implying any affiliation, endorsement, or partnership.
We make no representations or warranties, express or implied, regarding the accuracy, completeness, or suitability of any content or products presented. Nothing on this website should be construed as legal, tax, investment, financial, medical, or other professional advice. In addition, no part of this site—including articles or product references—constitutes a solicitation, recommendation, endorsement, advertisement, or offer to buy or sell any securities, franchises, or other financial instruments, particularly in jurisdictions where such activity would be unlawful.
All content is of a general nature and may not address the specific circumstances of any individual or entity. It is not a substitute for professional advice or services. Any actions you take based on the information provided here are strictly at your own risk. You accept full responsibility for any decisions or outcomes arising from your use of this website and agree to release us from any liability in connection with your use of, or reliance upon, the content or products found herein.