
|
Nepi Rockcastle S.A. (NRP.AS) Avaliação DCF |
Totalmente Editável: Adapte-Se Às Suas Necessidades No Excel Ou Planilhas
Design Profissional: Modelos Confiáveis E Padrão Da Indústria
Pré-Construídos Para Uso Rápido E Eficiente
Compatível com MAC/PC, totalmente desbloqueado
Não É Necessária Experiência; Fácil De Seguir
NEPI Rockcastle S.A. (NRP.AS) Bundle
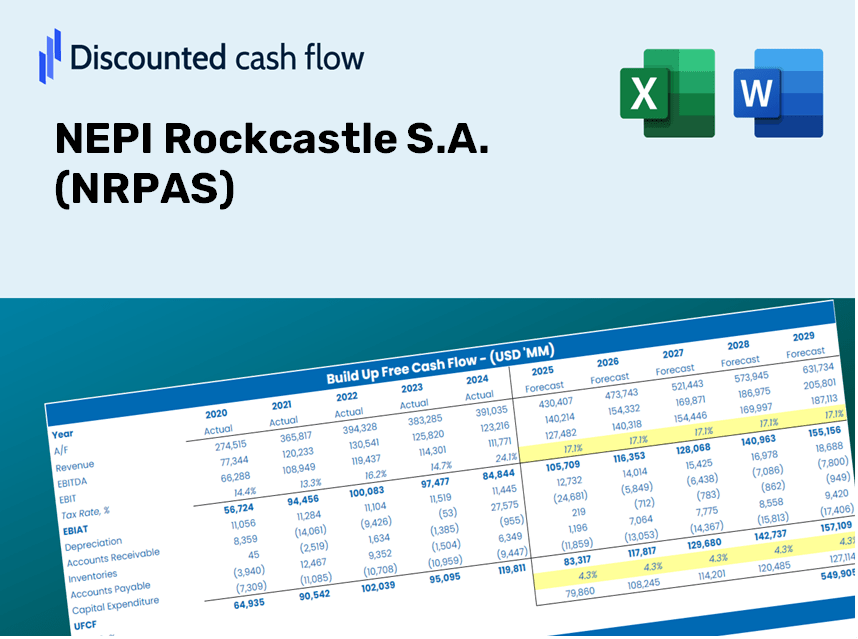
Explore as perspectivas financeiras do Nepi Rockcastle S.A. (NRPAs) com nossa calculadora DCF amigável! Digite suas suposições de crescimento, margens e despesas para calcular o valor intrínseco do NEPI Rockcastle S.A. (NRPAs) e aprimore sua estratégia de investimento.
Discounted Cash Flow (DCF) - (USD MM)
| Year | AY1 2020 |
AY2 2021 |
AY3 2022 |
AY4 2023 |
AY5 2024 |
FY1 2025 |
FY2 2026 |
FY3 2027 |
FY4 2028 |
FY5 2029 |
|---|---|---|---|---|---|---|---|---|---|---|
| Revenue | 536.5 | 536.7 | 625.1 | 774.3 | 853.4 | 961.3 | 1,082.9 | 1,219.8 | 1,374.1 | 1,547.8 |
| Revenue Growth, % | 0 | 0.04175249 | 16.47 | 23.86 | 10.21 | 12.65 | 12.65 | 12.65 | 12.65 | 12.65 |
| EBITDA | -143.1 | 325.3 | 559.9 | 617.2 | 751.8 | 560.0 | 630.9 | 710.6 | 800.5 | 901.8 |
| EBITDA, % | -26.68 | 60.6 | 89.56 | 79.71 | 88.1 | 58.26 | 58.26 | 58.26 | 58.26 | 58.26 |
| Depreciation | .6 | .6 | 1.5 | 1.5 | 2.1 | 1.7 | 1.9 | 2.2 | 2.5 | 2.8 |
| Depreciation, % | 0.10811 | 0.1198 | 0.23499 | 0.18972 | 0.24058 | 0.17864 | 0.17864 | 0.17864 | 0.17864 | 0.17864 |
| EBIT | -143.7 | 324.6 | 558.4 | 615.7 | 749.7 | 558.3 | 628.9 | 708.5 | 798.1 | 899.0 |
| EBIT, % | -26.78 | 60.49 | 89.33 | 79.52 | 87.86 | 58.08 | 58.08 | 58.08 | 58.08 | 58.08 |
| Total Cash | 639.6 | 498.6 | 246.4 | 338.5 | 448.5 | 631.7 | 711.6 | 801.6 | 903.0 | 1,017.2 |
| Total Cash, percent | .0 | .0 | .0 | .0 | .0 | .0 | .0 | .0 | .0 | .0 |
| Account Receivables | 2.9 | 2.5 | 5.0 | 94.1 | 115.9 | 52.9 | 59.6 | 67.2 | 75.7 | 85.2 |
| Account Receivables, % | 0.53961 | 0.46393 | 0.79806 | 12.15 | 13.59 | 5.51 | 5.51 | 5.51 | 5.51 | 5.51 |
| Inventories | .0 | 9.5 | 20.7 | .0 | 4.2 | 10.7 | 12.1 | 13.6 | 15.3 | 17.3 |
| Inventories, % | 0 | 1.77 | 3.31 | 0 | 0.49534 | 1.12 | 1.12 | 1.12 | 1.12 | 1.12 |
| Accounts Payable | 54.2 | 55.2 | 97.1 | 83.6 | 187.1 | 132.0 | 148.7 | 167.5 | 188.7 | 212.5 |
| Accounts Payable, % | 10.11 | 10.29 | 15.54 | 10.79 | 21.92 | 13.73 | 13.73 | 13.73 | 13.73 | 13.73 |
| Capital Expenditure | .0 | -71.2 | -142.9 | -193.0 | -147.2 | -150.6 | -169.6 | -191.0 | -215.2 | -242.4 |
| Capital Expenditure, % | 0 | -13.26 | -22.87 | -24.93 | -17.25 | -15.66 | -15.66 | -15.66 | -15.66 | -15.66 |
| Tax Rate, % | 9.55 | 9.55 | 9.55 | 9.55 | 9.55 | 9.55 | 9.55 | 9.55 | 9.55 | 9.55 |
| EBITAT | -124.2 | 291.2 | 484.4 | 537.0 | 678.1 | 491.9 | 554.1 | 624.2 | 703.2 | 792.1 |
| Depreciation | ||||||||||
| Changes in Account Receivables | ||||||||||
| Changes in Inventories | ||||||||||
| Changes in Accounts Payable | ||||||||||
| Capital Expenditure | ||||||||||
| UFCF | -72.3 | 212.6 | 371.2 | 263.5 | 610.4 | 344.5 | 395.1 | 445.1 | 501.4 | 564.8 |
| WACC, % | 5.6 | 5.65 | 5.6 | 5.61 | 5.66 | 5.62 | 5.62 | 5.62 | 5.62 | 5.62 |
| PV UFCF | ||||||||||
| SUM PV UFCF | 1,890.5 | |||||||||
| Long Term Growth Rate, % | 2.00 | |||||||||
| Free cash flow (T + 1) | 576 | |||||||||
| Terminal Value | 15,899 | |||||||||
| Present Terminal Value | 12,094 | |||||||||
| Enterprise Value | 13,985 | |||||||||
| Net Debt | 2,602 | |||||||||
| Equity Value | 11,383 | |||||||||
| Diluted Shares Outstanding, MM | 661 | |||||||||
| Equity Value Per Share | 17.23 |
Benefits You'll Receive
- Customizable Excel Template: An adaptable Excel-based DCF Calculator featuring pre-populated financials for NEPI Rockcastle S.A. (NRPAS).
- Comprehensive Data: Access to historical performance metrics and future projections (highlighted in the yellow cells).
- Assumption Flexibility: Adjust key forecast parameters, including revenue growth, EBITDA margin, and WACC.
- Instant Calculations: Quickly visualize the effects of your inputs on NEPI Rockcastle S.A. (NRPAS)'s valuation.
- Professional Resource: Designed for investors, CFOs, consultants, and financial analysts.
- User-Centric Layout: Organized for simplicity and ease of navigation, complete with step-by-step guidance.
Key Features
- Pre-Loaded Data: NEPI Rockcastle S.A. (NRPAS) historical financial statements and pre-filled forecasts.
- Fully Adjustable Inputs: Customize WACC, tax rates, revenue growth, and EBITDA margins.
- Instant Results: View NEPI Rockcastle S.A. (NRPAS) intrinsic value updating in real-time.
- Clear Visual Outputs: Dashboard charts that showcase valuation results and essential metrics.
- Built for Accuracy: A professional-grade tool tailored for analysts, investors, and finance professionals.
How It Operates
- Step 1: Download the Excel spreadsheet.
- Step 2: Examine NEPI Rockcastle S.A.'s pre-filled financial data and projections.
- Step 3: Adjust key inputs such as revenue growth, WACC, and tax rates (highlighted cells).
- Step 4: Observe the DCF model update in real-time as you modify your assumptions.
- Step 5: Interpret the results and leverage the findings for informed investment decisions.
Why Opt for This Calculator?
- User-Friendly Interface: Perfect for both novices and seasoned professionals.
- Customizable Parameters: Easily adjust inputs to suit your specific analysis.
- Real-Time Updates: Instantly view changes to NEPI Rockcastle S.A.'s (NRPAS) valuation as you modify inputs.
- Pre-Loaded Data: Comes equipped with NEPI Rockcastle S.A.'s actual financial figures for swift evaluations.
- Relied Upon by Experts: Utilized by investors and analysts to make well-informed decisions.
Who Can Benefit from NEPI Rockcastle S.A. (NRPAS)?
- Institutional Investors: Develop comprehensive valuation models for their real estate portfolios.
- Corporate Strategy Teams: Evaluate various valuation scenarios to shape strategic decisions.
- Financial Consultants: Deliver precise valuation analyses to clients investing in NRPA.
- Students and Faculty: Utilize real-time data to enhance financial modeling skills in academic settings.
- Real Estate Enthusiasts: Gain insights into how companies like NEPI Rockcastle S.A. (NRPAS) are valued within the property market.
Overview of the Template Features
- In-Depth DCF Model: A fully editable template providing extensive valuation calculations.
- Real-Time Financial Data: Historical and projected financial metrics for NEPI Rockcastle S.A. (NRPAS) preloaded for comprehensive analysis.
- Adjustable Assumptions: Modify WACC, growth rates, and tax considerations to explore various scenarios.
- Detailed Financial Statements: Complete annual and quarterly reports offering deeper financial insights.
- Essential Ratios: Integrated analysis of profitability, efficiency, and leverage metrics.
- User-Friendly Dashboard: Visual charts and tables presenting clear and actionable results.
Disclaimer
All information, articles, and product details provided on this website are for general informational and educational purposes only. We do not claim any ownership over, nor do we intend to infringe upon, any trademarks, copyrights, logos, brand names, or other intellectual property mentioned or depicted on this site. Such intellectual property remains the property of its respective owners, and any references here are made solely for identification or informational purposes, without implying any affiliation, endorsement, or partnership.
We make no representations or warranties, express or implied, regarding the accuracy, completeness, or suitability of any content or products presented. Nothing on this website should be construed as legal, tax, investment, financial, medical, or other professional advice. In addition, no part of this site—including articles or product references—constitutes a solicitation, recommendation, endorsement, advertisement, or offer to buy or sell any securities, franchises, or other financial instruments, particularly in jurisdictions where such activity would be unlawful.
All content is of a general nature and may not address the specific circumstances of any individual or entity. It is not a substitute for professional advice or services. Any actions you take based on the information provided here are strictly at your own risk. You accept full responsibility for any decisions or outcomes arising from your use of this website and agree to release us from any liability in connection with your use of, or reliance upon, the content or products found herein.