
|
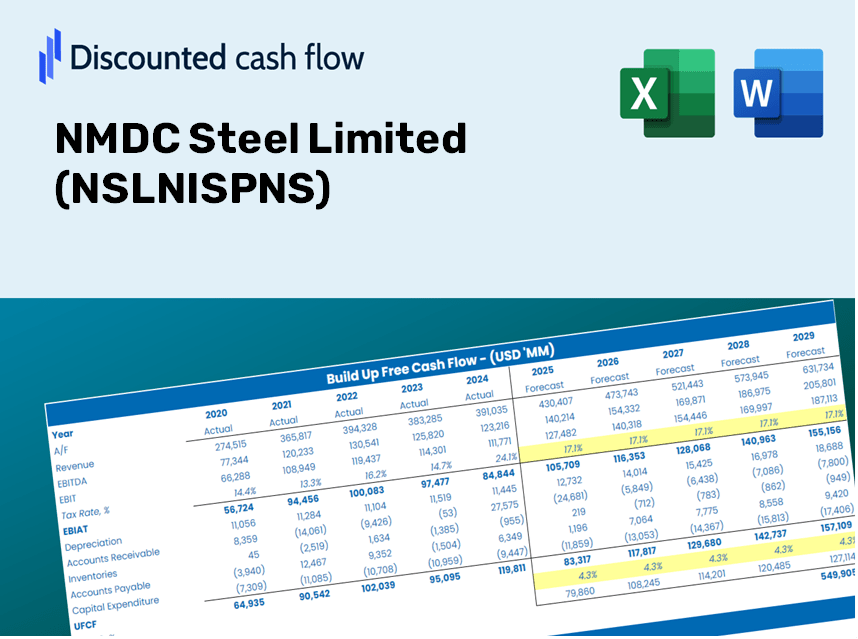
NMDC Steel Limited (NSLNISP.NS) Avaliação DCF |
Totalmente Editável: Adapte-Se Às Suas Necessidades No Excel Ou Planilhas
Design Profissional: Modelos Confiáveis E Padrão Da Indústria
Pré-Construídos Para Uso Rápido E Eficiente
Compatível com MAC/PC, totalmente desbloqueado
Não É Necessária Experiência; Fácil De Seguir
NMDC Steel Limited (NSLNISP.NS) Bundle
Otimize seu tempo e melhore a precisão com a nossa calculadora DCF (NSLNISPNS)! Equipado com dados reais da NMDC Steel Limited e suposições personalizáveis, essa ferramenta capacita você a prever, analisar e valorizar a aço NMDC como um investidor experiente.
Discounted Cash Flow (DCF) - (USD MM)
| Year | AY1 2021 |
AY2 2022 |
AY3 2023 |
AY4 2024 |
AY5 2025 |
FY1 2026 |
FY2 2027 |
FY3 2028 |
FY4 2029 |
FY5 2030 |
|---|---|---|---|---|---|---|---|---|---|---|
| Revenue | .0 | .0 | 30,489.9 | 85,030.5 | 106,288.1 | 132,860.2 | 166,075.2 | 207,594.0 | 259,492.5 | |
| Revenue Growth, % | 0 | 0 | 0 | 0 | 178.88 | 25 | 25 | 25 | 25 | 25 |
| EBITDA | -.1 | .0 | -13,176.3 | -17,167.4 | 50,294.5 | 62,868.1 | 78,585.1 | 98,231.4 | 122,789.3 | |
| EBITDA, % | 100 | 100 | 100 | -43.22 | -20.19 | 47.32 | 47.32 | 47.32 | 47.32 | 47.32 |
| Depreciation | .1 | .0 | 5,528.0 | 9,530.4 | 70,009.6 | 87,512.0 | 109,390.0 | 136,737.5 | 170,921.9 | |
| Depreciation, % | 100 | 100 | 100 | 18.13 | 11.21 | 65.87 | 65.87 | 65.87 | 65.87 | 65.87 |
| EBIT | -.1 | .0 | -18,704.3 | -26,697.8 | 44,057.7 | 55,072.2 | 68,840.2 | 86,050.3 | 107,562.9 | |
| EBIT, % | 100 | 100 | 100 | -61.35 | -31.4 | 41.45 | 41.45 | 41.45 | 41.45 | 41.45 |
| Total Cash | .0 | 8.2 | 6,545.8 | 1,820.7 | 9,615.4 | 67,446.1 | 84,307.7 | 105,384.6 | 131,730.7 | 164,663.4 |
| Total Cash, percent | .0 | .0 | .0 | .0 | .0 | .0 | .0 | .0 | .0 | .0 |
| Account Receivables | .0 | 518.0 | 195.8 | 619.0 | 1,974.8 | 64,698.1 | 80,872.7 | 101,090.8 | 126,363.6 | 157,954.5 |
| Account Receivables, % | 100 | 100 | 100 | 2.03 | 2.32 | 60.87 | 60.87 | 60.87 | 60.87 | 60.87 |
| Inventories | .0 | 396.8 | 8,595.4 | 37,034.2 | 30,568.3 | 92,672.6 | 115,840.7 | 144,800.9 | 181,001.1 | 226,251.4 |
| Inventories, % | 100 | 100 | 100 | 121.46 | 35.95 | 87.19 | 87.19 | 87.19 | 87.19 | 87.19 |
| Accounts Payable | .0 | 3,900.6 | 3,900.6 | 25,027.1 | 48,317.2 | 93,301.1 | 116,626.4 | 145,783.0 | 182,228.8 | 227,785.9 |
| Accounts Payable, % | 100 | 100 | 100 | 82.08 | 56.82 | 87.78 | 87.78 | 87.78 | 87.78 | 87.78 |
| Capital Expenditure | .0 | -18,909.9 | -21,551.9 | -5,839.2 | -4,275.5 | -5,140.0 | -6,425.0 | -8,031.2 | -10,039.0 | -12,548.8 |
| Capital Expenditure, % | 100 | 100 | 100 | -19.15 | -5.03 | -4.84 | -4.84 | -4.84 | -4.84 | -4.84 |
| Tax Rate, % | 28.54 | 28.54 | 28.54 | 28.54 | 28.54 | 28.54 | 28.54 | 28.54 | 28.54 | 28.54 |
| EBITAT | -.1 | .0 | -13,259.6 | -19,078.9 | 38,978.2 | 48,722.7 | 60,903.4 | 76,129.2 | 95,161.5 | |
| Depreciation | ||||||||||
| Changes in Account Receivables | ||||||||||
| Changes in Inventories | ||||||||||
| Changes in Accounts Payable | ||||||||||
| Capital Expenditure | ||||||||||
| UFCF | -.1 | -29,428.3 | -21,306.3 | 14,576.2 | 24,004.1 | 113,792.3 | 142,240.4 | 177,800.5 | 222,250.7 | |
| WACC, % | 6.72 | 6.72 | 6.72 | 5.69 | 5.71 | 6.31 | 6.31 | 6.31 | 6.31 | 6.31 |
| PV UFCF | ||||||||||
| SUM PV UFCF | 544,518.7 | |||||||||
| Long Term Growth Rate, % | 2.00 | |||||||||
| Free cash flow (T + 1) | 226,696 | |||||||||
| Terminal Value | 5,259,617 | |||||||||
| Present Terminal Value | 3,873,299 | |||||||||
| Enterprise Value | 4,417,818 | |||||||||
| Net Debt | 59,019 | |||||||||
| Equity Value | 4,358,799 | |||||||||
| Diluted Shares Outstanding, MM | 2,926 | |||||||||
| Equity Value Per Share | 1,489.78 |
Benefits You'll Receive
- Authentic NMDC Data: Preloaded financials – covering everything from revenue to EBIT – derived from actual and projected information.
- Comprehensive Customization: Modify all essential parameters (yellow cells) such as WACC, growth %, and tax rates to fit your needs.
- Real-Time Valuation Updates: Automatic recalculations to assess the effects of changes on NMDC Steel Limited’s fair value.
- Flexible Excel Template: Designed for easy edits, scenario analysis, and in-depth forecasts.
- Efficiency and Precision: Eliminate the need to create models from scratch while ensuring both accuracy and adaptability.
Core Features
- Authentic NMDC Steel Financials: Gain access to reliable pre-loaded historical data along with future forecasts.
- Adjustable Forecast Parameters: Modify highlighted cells for key metrics such as WACC, growth rates, and profit margins.
- Real-Time Calculations: Enjoy automatic updates for DCF, Net Present Value (NPV), and cash flow evaluations.
- Interactive Dashboard: Utilize clear charts and summaries to effectively visualize your valuation outcomes.
- Suitable for All Skill Levels: A user-friendly layout designed for investors, CFOs, and consultants alike.
How It Operates
- Download the Template: Gain immediate access to the Excel-based NMDC Steel Limited (NSLNISPNS) Valuation Model.
- Input Your Assumptions: Modify the cells highlighted in yellow to set your growth rates, WACC, profit margins, and other parameters.
- Instant Calculations: The model automatically calculates the intrinsic value of NMDC Steel Limited (NSLNISPNS).
- Test Scenarios: Explore various assumptions to assess how valuation may fluctuate.
- Analyze and Decide: Utilize the findings to inform your investment strategy or financial assessment.
Why Opt for This Calculator?
- All-in-One Solution: Combines DCF, WACC, and financial ratio analysis conveniently.
- Flexible Inputs: Modify the yellow-highlighted fields to explore different scenarios.
- In-Depth Analysis: Automatically computes the intrinsic value and Net Present Value for NMDC Steel Limited (NSLNISPNS).
- Preloaded Information: Access to historical and projected data for precise benchmarks.
- High-Quality Standards: Perfect for financial analysts, investors, and business advisors.
Who Should Utilize This Product?
- Investors: Assess the true value of NMDC Steel Limited (NSLNISPNS) to make informed investment choices.
- CFOs: Utilize a high-quality DCF model for accurate financial reporting and analysis.
- Consultants: Efficiently customize the template for client valuation reports.
- Entrepreneurs: Discover financial modeling strategies employed by leading companies.
- Educators: Implement it as a resource to teach valuation techniques effectively.
Contents of the Template
- Preloaded NMDC Steel Data: Historical and projected financial information, including revenue, EBIT, and capital expenditures.
- DCF and WACC Models: Professional-grade worksheets for assessing intrinsic value and Weighted Average Cost of Capital.
- Editable Inputs: Yellow-highlighted cells for modifying revenue growth, tax rates, and discount rates.
- Financial Statements: Detailed annual and quarterly financials for extensive analysis.
- Key Ratios: Profitability, leverage, and efficiency ratios for performance evaluation.
- Dashboard and Charts: Visual representations of valuation results and underlying assumptions.
Disclaimer
All information, articles, and product details provided on this website are for general informational and educational purposes only. We do not claim any ownership over, nor do we intend to infringe upon, any trademarks, copyrights, logos, brand names, or other intellectual property mentioned or depicted on this site. Such intellectual property remains the property of its respective owners, and any references here are made solely for identification or informational purposes, without implying any affiliation, endorsement, or partnership.
We make no representations or warranties, express or implied, regarding the accuracy, completeness, or suitability of any content or products presented. Nothing on this website should be construed as legal, tax, investment, financial, medical, or other professional advice. In addition, no part of this site—including articles or product references—constitutes a solicitation, recommendation, endorsement, advertisement, or offer to buy or sell any securities, franchises, or other financial instruments, particularly in jurisdictions where such activity would be unlawful.
All content is of a general nature and may not address the specific circumstances of any individual or entity. It is not a substitute for professional advice or services. Any actions you take based on the information provided here are strictly at your own risk. You accept full responsibility for any decisions or outcomes arising from your use of this website and agree to release us from any liability in connection with your use of, or reliance upon, the content or products found herein.