
|
Insperity, Inc. (NSP) DCF Avaliação |
Totalmente Editável: Adapte-Se Às Suas Necessidades No Excel Ou Planilhas
Design Profissional: Modelos Confiáveis E Padrão Da Indústria
Pré-Construídos Para Uso Rápido E Eficiente
Compatível com MAC/PC, totalmente desbloqueado
Não É Necessária Experiência; Fácil De Seguir
Insperity, Inc. (NSP) Bundle
Obtenha informações sobre sua análise de avaliação da Insperity, Inc. (NSP) usando nossa calculadora DCF de última geração! Este modelo do Excel é pré -carregado com dados reais do NSP, permitindo que você ajuste as previsões e suposições para determinar com precisão o valor intrínseco da Insperity, Inc.
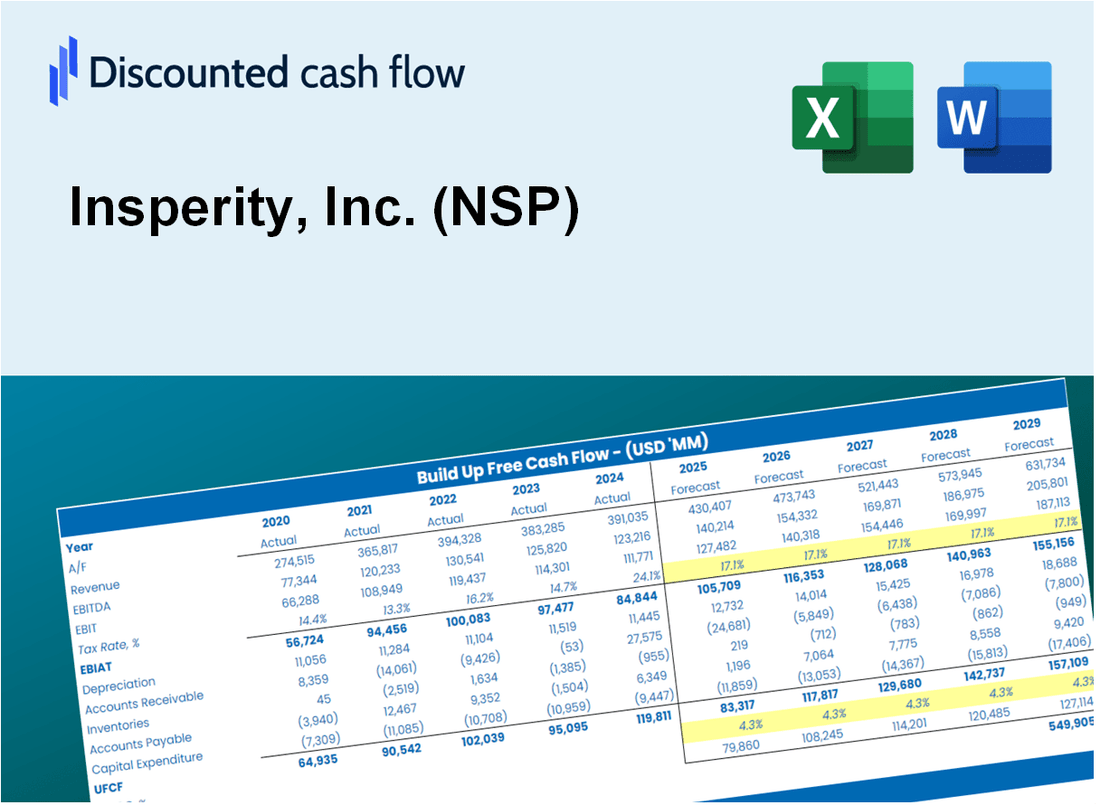
Discounted Cash Flow (DCF) - (USD MM)
| Year | AY1 2020 |
AY2 2021 |
AY3 2022 |
AY4 2023 |
AY5 2024 |
FY1 2025 |
FY2 2026 |
FY3 2027 |
FY4 2028 |
FY5 2029 |
|---|---|---|---|---|---|---|---|---|---|---|
| Revenue | 4,287.0 | 4,973.1 | 5,938.8 | 6,486.0 | 6,581.0 | 7,339.5 | 8,185.4 | 9,128.8 | 10,180.9 | 11,354.3 |
| Revenue Growth, % | 0 | 16 | 19.42 | 9.21 | 1.46 | 11.53 | 11.53 | 11.53 | 11.53 | 11.53 |
| EBITDA | 228.5 | 214.3 | 300.3 | 295.0 | 198.0 | 326.6 | 364.3 | 406.3 | 453.1 | 505.3 |
| EBITDA, % | 5.33 | 4.31 | 5.06 | 4.55 | 3.01 | 4.45 | 4.45 | 4.45 | 4.45 | 4.45 |
| Depreciation | 31.2 | 38.5 | 40.7 | 43.0 | 44.0 | 51.7 | 57.6 | 64.2 | 71.6 | 79.9 |
| Depreciation, % | 0.72752 | 0.77511 | 0.68465 | 0.66297 | 0.66859 | 0.70377 | 0.70377 | 0.70377 | 0.70377 | 0.70377 |
| EBIT | 197.3 | 175.8 | 259.6 | 252.0 | 154.0 | 275.0 | 306.7 | 342.0 | 381.5 | 425.4 |
| EBIT, % | 4.6 | 3.53 | 4.37 | 3.89 | 2.34 | 3.75 | 3.75 | 3.75 | 3.75 | 3.75 |
| Total Cash | 589.4 | 607.6 | 765.9 | 709.0 | 1,055.0 | 966.2 | 1,077.6 | 1,201.8 | 1,340.3 | 1,494.8 |
| Total Cash, percent | .0 | .0 | .0 | .0 | .0 | .0 | .0 | .0 | .0 | .0 |
| Account Receivables | 392.7 | 525.7 | 622.8 | 694.0 | 829.0 | 785.6 | 876.1 | 977.1 | 1,089.7 | 1,215.3 |
| Account Receivables, % | 9.16 | 10.57 | 10.49 | 10.7 | 12.6 | 10.7 | 10.7 | 10.7 | 10.7 | 10.7 |
| Inventories | .0 | .0 | .0 | .0 | .0 | .0 | .0 | .0 | .0 | .0 |
| Inventories, % | 0 | 0 | 0 | 0 | 0 | 0 | 0 | 0 | 0 | 0 |
| Accounts Payable | 6.2 | 6.4 | 7.7 | 11.0 | 10.0 | 10.6 | 11.9 | 13.2 | 14.8 | 16.5 |
| Accounts Payable, % | 0.14469 | 0.12893 | 0.13019 | 0.1696 | 0.15195 | 0.14507 | 0.14507 | 0.14507 | 0.14507 | 0.14507 |
| Capital Expenditure | -98.2 | -32.9 | -30.3 | -40.1 | -38.0 | -68.4 | -76.3 | -85.0 | -94.8 | -105.8 |
| Capital Expenditure, % | -2.29 | -0.6617 | -0.51069 | -0.61852 | -0.57742 | -0.9316 | -0.9316 | -0.9316 | -0.9316 | -0.9316 |
| Tax Rate, % | 27.78 | 27.78 | 27.78 | 27.78 | 27.78 | 27.78 | 27.78 | 27.78 | 27.78 | 27.78 |
| EBITAT | 144.1 | 129.6 | 189.7 | 191.5 | 111.2 | 202.4 | 225.8 | 251.8 | 280.8 | 313.2 |
| Depreciation | ||||||||||
| Changes in Account Receivables | ||||||||||
| Changes in Inventories | ||||||||||
| Changes in Accounts Payable | ||||||||||
| Capital Expenditure | ||||||||||
| UFCF | -309.4 | 2.5 | 104.3 | 126.4 | -18.8 | 229.8 | 117.8 | 131.4 | 146.5 | 163.4 |
| WACC, % | 5.59 | 5.6 | 5.59 | 5.64 | 5.57 | 5.6 | 5.6 | 5.6 | 5.6 | 5.6 |
| PV UFCF | ||||||||||
| SUM PV UFCF | 677.1 | |||||||||
| Long Term Growth Rate, % | 3.00 | |||||||||
| Free cash flow (T + 1) | 168 | |||||||||
| Terminal Value | 6,482 | |||||||||
| Present Terminal Value | 4,937 | |||||||||
| Enterprise Value | 5,614 | |||||||||
| Net Debt | -604 | |||||||||
| Equity Value | 6,218 | |||||||||
| Diluted Shares Outstanding, MM | 38 | |||||||||
| Equity Value Per Share | 163.64 |
What You Will Receive
- Adjustable Forecast Inputs: Effortlessly modify assumptions (growth %, margins, WACC) to explore various scenarios.
- Comprehensive Data: Insperity, Inc.'s (NSP) financial information pre-loaded to facilitate your analysis.
- Instant DCF Outputs: The template automatically computes Net Present Value (NPV) and intrinsic value for you.
- Tailored and Professional: A sleek Excel model designed to meet your valuation requirements.
- Designed for Analysts and Investors: Perfect for evaluating projections, confirming strategies, and enhancing efficiency.
Key Features
- Comprehensive Insperity Financials: Gain access to reliable pre-loaded historical data and future forecasts.
- Adjustable Forecast Parameters: Modify highlighted cells such as WACC, growth rates, and profit margins.
- Real-Time Calculations: Automatic updates for DCF, Net Present Value (NPV), and cash flow assessments.
- Interactive Dashboard: User-friendly charts and summaries to help visualize your valuation outcomes.
- Designed for All Levels: An intuitive layout suitable for investors, CFOs, and consultants alike.
How It Works
- Step 1: Download the Excel file.
- Step 2: Review Insperity, Inc.'s (NSP) pre-filled financial data and forecasts.
- Step 3: Modify critical inputs such as revenue growth, WACC, and tax rates (highlighted cells).
- Step 4: Observe the DCF model update in real-time as you adjust your assumptions.
- Step 5: Analyze the outputs and leverage the results for your investment decisions.
Why Choose This Calculator?
- User-Friendly Interface: Ideal for both novices and seasoned professionals.
- Customizable Inputs: Easily adjust parameters to suit your financial analysis.
- Real-Time Feedback: Observe immediate changes to Insperity’s valuation as you modify inputs.
- Pre-Loaded Data: Comes with Insperity’s actual financial metrics for swift evaluations.
- Relied Upon by Experts: Favored by investors and analysts for making strategic decisions.
Who Should Use Insperity, Inc. (NSP)?
- HR Professionals: Streamline workforce management and enhance employee engagement.
- Small Business Owners: Access comprehensive HR solutions to support business growth.
- Consultants and Advisors: Offer clients tailored HR strategies and compliance guidance.
- Students and Educators: Explore real-world applications of HR practices and business management.
- Entrepreneurs: Learn how effective HR can drive success in startups and small enterprises.
What the Template Contains
- Operating and Balance Sheet Data: Pre-filled Insperity, Inc. (NSP) historical data and forecasts, including revenue, EBITDA, EBIT, and capital expenditures.
- WACC Calculation: A dedicated sheet for Weighted Average Cost of Capital (WACC), including parameters like Beta, risk-free rate, and share price.
- DCF Valuation (Unlevered and Levered): Editable Discounted Cash Flow models showing intrinsic value with detailed calculations.
- Financial Statements: Pre-loaded financial statements (annual and quarterly) to support analysis.
- Key Ratios: Includes profitability, leverage, and efficiency ratios for Insperity, Inc. (NSP).
- Dashboard and Charts: Visual summary of valuation outputs and assumptions to analyze results easily.
Disclaimer
All information, articles, and product details provided on this website are for general informational and educational purposes only. We do not claim any ownership over, nor do we intend to infringe upon, any trademarks, copyrights, logos, brand names, or other intellectual property mentioned or depicted on this site. Such intellectual property remains the property of its respective owners, and any references here are made solely for identification or informational purposes, without implying any affiliation, endorsement, or partnership.
We make no representations or warranties, express or implied, regarding the accuracy, completeness, or suitability of any content or products presented. Nothing on this website should be construed as legal, tax, investment, financial, medical, or other professional advice. In addition, no part of this site—including articles or product references—constitutes a solicitation, recommendation, endorsement, advertisement, or offer to buy or sell any securities, franchises, or other financial instruments, particularly in jurisdictions where such activity would be unlawful.
All content is of a general nature and may not address the specific circumstances of any individual or entity. It is not a substitute for professional advice or services. Any actions you take based on the information provided here are strictly at your own risk. You accept full responsibility for any decisions or outcomes arising from your use of this website and agree to release us from any liability in connection with your use of, or reliance upon, the content or products found herein.