
|
Avaliação DCF NetStreit Corp. (NTST) |
Totalmente Editável: Adapte-Se Às Suas Necessidades No Excel Ou Planilhas
Design Profissional: Modelos Confiáveis E Padrão Da Indústria
Pré-Construídos Para Uso Rápido E Eficiente
Compatível com MAC/PC, totalmente desbloqueado
Não É Necessária Experiência; Fácil De Seguir
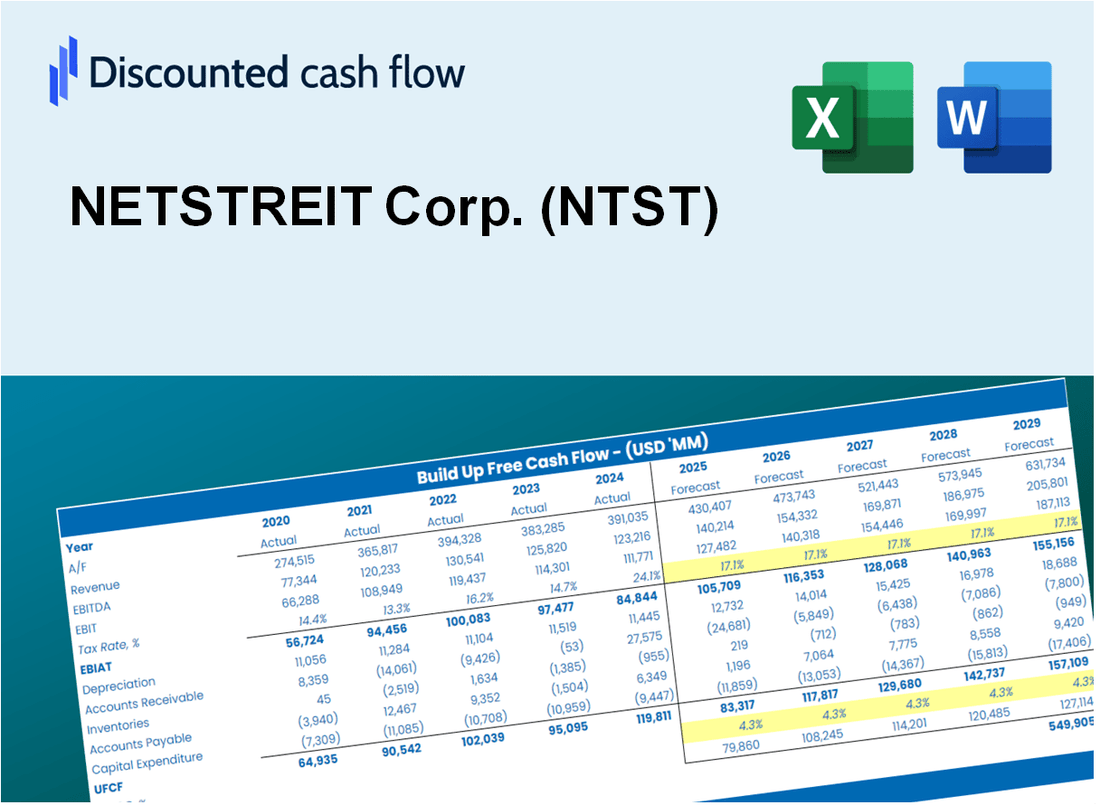
NETSTREIT Corp. (NTST) Bundle
Aprimore sua estratégia de investimento com a calculadora DCF NetStreit Corp. (NTST)! Utilize dados financeiros precisos do NetStreit, ajuste as premissas e despesas de crescimento e observe instantaneamente como esses ajustes afetam o valor intrínseco da NetStreit Corp. (NTST).
Discounted Cash Flow (DCF) - (USD MM)
| Year | AY1 2020 |
AY2 2021 |
AY3 2022 |
AY4 2023 |
AY5 2024 |
FY1 2025 |
FY2 2026 |
FY3 2027 |
FY4 2028 |
FY5 2029 |
|---|---|---|---|---|---|---|---|---|---|---|
| Revenue | 33.7 | 59.1 | 96.8 | 131.9 | 150.0 | 220.9 | 325.3 | 479.0 | 705.3 | 1,038.6 |
| Revenue Growth, % | 0 | 75.35 | 63.71 | 36.24 | 13.72 | 47.26 | 47.26 | 47.26 | 47.26 | 47.26 |
| EBITDA | 16.6 | 37.9 | 65.2 | 94.9 | 98.2 | 140.6 | 207.1 | 304.9 | 449.0 | 661.2 |
| EBITDA, % | 49.36 | 64.17 | 67.38 | 71.92 | 65.49 | 63.66 | 63.66 | 63.66 | 63.66 | 63.66 |
| Depreciation | 15.5 | 30.8 | 50.6 | 63.7 | 76.9 | 110.3 | 162.5 | 239.2 | 352.3 | 518.7 |
| Depreciation, % | 45.84 | 52.09 | 52.28 | 48.27 | 51.25 | 49.95 | 49.95 | 49.95 | 49.95 | 49.95 |
| EBIT | 1.2 | 7.1 | 14.6 | 31.2 | 21.4 | 30.3 | 44.6 | 65.7 | 96.8 | 142.5 |
| EBIT, % | 3.53 | 12.08 | 15.1 | 23.64 | 14.24 | 13.72 | 13.72 | 13.72 | 13.72 | 13.72 |
| Total Cash | 92.6 | 7.6 | 89.9 | 18.4 | 14.3 | 101.3 | 149.1 | 219.6 | 323.4 | 476.2 |
| Total Cash, percent | .0 | .0 | .0 | .0 | .0 | .0 | .0 | .0 | .0 | .0 |
| Account Receivables | 2.9 | 5.1 | 46.4 | 133.7 | 164.0 | 117.1 | 172.4 | 253.9 | 373.9 | 550.6 |
| Account Receivables, % | 8.59 | 8.56 | 47.9 | 101.35 | 109.36 | 53.01 | 53.01 | 53.01 | 53.01 | 53.01 |
| Inventories | .0 | -4.3 | -8.7 | .0 | .0 | -7.2 | -10.6 | -15.6 | -23.0 | -33.9 |
| Inventories, % | 0 | -7.29 | -9.04 | 0 | 0 | -3.26 | -3.26 | -3.26 | -3.26 | -3.26 |
| Accounts Payable | .9 | .4 | 1.4 | 4.7 | 3.1 | 4.6 | 6.8 | 10.0 | 14.7 | 21.7 |
| Accounts Payable, % | 2.72 | 0.70849 | 1.44 | 3.56 | 2.04 | 2.09 | 2.09 | 2.09 | 2.09 | 2.09 |
| Capital Expenditure | -.1 | -.7 | -1.2 | .0 | .0 | -1.2 | -1.7 | -2.6 | -3.8 | -5.5 |
| Capital Expenditure, % | -0.15121 | -1.24 | -1.25 | -0.02653425 | -0.00533319 | -0.5337 | -0.5337 | -0.5337 | -0.5337 | -0.5337 |
| Tax Rate, % | 0.11715 | 0.11715 | 0.11715 | 0.11715 | 0.11715 | 0.11715 | 0.11715 | 0.11715 | 0.11715 | 0.11715 |
| EBITAT | 4.1 | 6.8 | 13.8 | 31.2 | 21.3 | 29.6 | 43.6 | 64.3 | 94.6 | 139.4 |
| Depreciation | ||||||||||
| Changes in Account Receivables | ||||||||||
| Changes in Inventories | ||||||||||
| Changes in Accounts Payable | ||||||||||
| Capital Expenditure | ||||||||||
| UFCF | 17.5 | 38.5 | 27.3 | 2.0 | 66.2 | 194.5 | 154.6 | 227.7 | 335.3 | 493.7 |
| WACC, % | 6.31 | 6.24 | 6.23 | 6.31 | 6.31 | 6.28 | 6.28 | 6.28 | 6.28 | 6.28 |
| PV UFCF | ||||||||||
| SUM PV UFCF | 1,136.5 | |||||||||
| Long Term Growth Rate, % | 2.00 | |||||||||
| Free cash flow (T + 1) | 504 | |||||||||
| Terminal Value | 11,764 | |||||||||
| Present Terminal Value | 8,675 | |||||||||
| Enterprise Value | 9,811 | |||||||||
| Net Debt | 880 | |||||||||
| Equity Value | 8,931 | |||||||||
| Diluted Shares Outstanding, MM | 77 | |||||||||
| Equity Value Per Share | 116.72 |
What You Will Receive
- Adjustable Forecast Parameters: Effortlessly modify key assumptions (growth %, margins, WACC) to explore various scenarios.
- Comprehensive Financial Data: NETSTREIT Corp.’s (NTST) financial information pre-loaded to facilitate your analysis.
- Instant DCF Calculations: The template automatically computes Net Present Value (NPV) and intrinsic value for your convenience.
- Tailored and Professional Design: A refined Excel model that can be customized to meet your valuation requirements.
- Designed for Analysts and Investors: Perfect for evaluating forecasts, confirming strategies, and enhancing efficiency.
Key Features
- Comprehensive Data: NETSTREIT Corp.'s (NTST) historical financial statements and pre-filled projections.
- Customizable Inputs: Modify WACC, tax rates, revenue growth, and EBITDA margins to suit your analysis.
- Real-Time Insights: Observe NETSTREIT Corp.'s (NTST) intrinsic value update instantly.
- Intuitive Visualizations: Dashboard graphs present valuation outcomes and essential metrics clearly.
- Designed for Precision: A reliable tool tailored for analysts, investors, and finance professionals.
How It Works
- Step 1: Download the Excel file.
- Step 2: Review pre-entered NETSTREIT Corp. (NTST) data (historical and projected).
- Step 3: Adjust key assumptions (yellow cells) based on your analysis.
- Step 4: View automatic recalculations for NETSTREIT Corp.'s (NTST) intrinsic value.
- Step 5: Use the outputs for investment decisions or reporting.
Why Choose NETSTREIT Corp. (NTST) Calculator?
- Reliable Data: Utilize accurate NETSTREIT financials for trustworthy valuation outcomes.
- Flexible Options: Modify essential inputs such as growth rates, WACC, and tax rates to align with your forecasts.
- Efficiency Boost: Built-in calculations save you the hassle of starting from the ground up.
- Professional-Quality Tool: Tailored for investors, analysts, and financial consultants.
- Easy to Use: Clear design and guided instructions ensure accessibility for all users.
Who Should Use NETSTREIT Corp. (NTST)?
- Real Estate Students: Understand investment strategies and apply them to real estate data.
- Researchers: Utilize industry models in academic studies or projects focused on real estate investment trusts (REITs).
- Investors: Evaluate your investment strategies and analyze valuation metrics for NETSTREIT Corp. (NTST).
- Financial Analysts: Enhance your analytical processes with a customizable financial model tailored for REITs.
- Small Investors: Learn about the analysis of publicly traded REITs like NETSTREIT Corp. (NTST) to inform your investment decisions.
What the Template Contains
- Pre-Filled Data: Includes NETSTREIT Corp.'s historical financials and forecasts.
- Discounted Cash Flow Model: Editable DCF valuation model with automatic calculations.
- Weighted Average Cost of Capital (WACC): A dedicated sheet for calculating WACC based on custom inputs.
- Key Financial Ratios: Analyze NETSTREIT Corp.'s profitability, efficiency, and leverage.
- Customizable Inputs: Edit revenue growth, margins, and tax rates with ease.
- Clear Dashboard: Charts and tables summarizing key valuation results.
Disclaimer
All information, articles, and product details provided on this website are for general informational and educational purposes only. We do not claim any ownership over, nor do we intend to infringe upon, any trademarks, copyrights, logos, brand names, or other intellectual property mentioned or depicted on this site. Such intellectual property remains the property of its respective owners, and any references here are made solely for identification or informational purposes, without implying any affiliation, endorsement, or partnership.
We make no representations or warranties, express or implied, regarding the accuracy, completeness, or suitability of any content or products presented. Nothing on this website should be construed as legal, tax, investment, financial, medical, or other professional advice. In addition, no part of this site—including articles or product references—constitutes a solicitation, recommendation, endorsement, advertisement, or offer to buy or sell any securities, franchises, or other financial instruments, particularly in jurisdictions where such activity would be unlawful.
All content is of a general nature and may not address the specific circumstances of any individual or entity. It is not a substitute for professional advice or services. Any actions you take based on the information provided here are strictly at your own risk. You accept full responsibility for any decisions or outcomes arising from your use of this website and agree to release us from any liability in connection with your use of, or reliance upon, the content or products found herein.