
|
Nuwellis, Inc. (Nuwe) DCF Avaliação |
Totalmente Editável: Adapte-Se Às Suas Necessidades No Excel Ou Planilhas
Design Profissional: Modelos Confiáveis E Padrão Da Indústria
Pré-Construídos Para Uso Rápido E Eficiente
Compatível com MAC/PC, totalmente desbloqueado
Não É Necessária Experiência; Fácil De Seguir
Nuwellis, Inc. (NUWE) Bundle
Simplifique sua análise e melhore a precisão com a nossa calculadora DCF [NUWE]! Utilizando dados reais da Nuwellis, Inc. e suposições personalizáveis, essa ferramenta capacita você a prever, avaliar e avaliar [Empresa] como um investidor experiente.
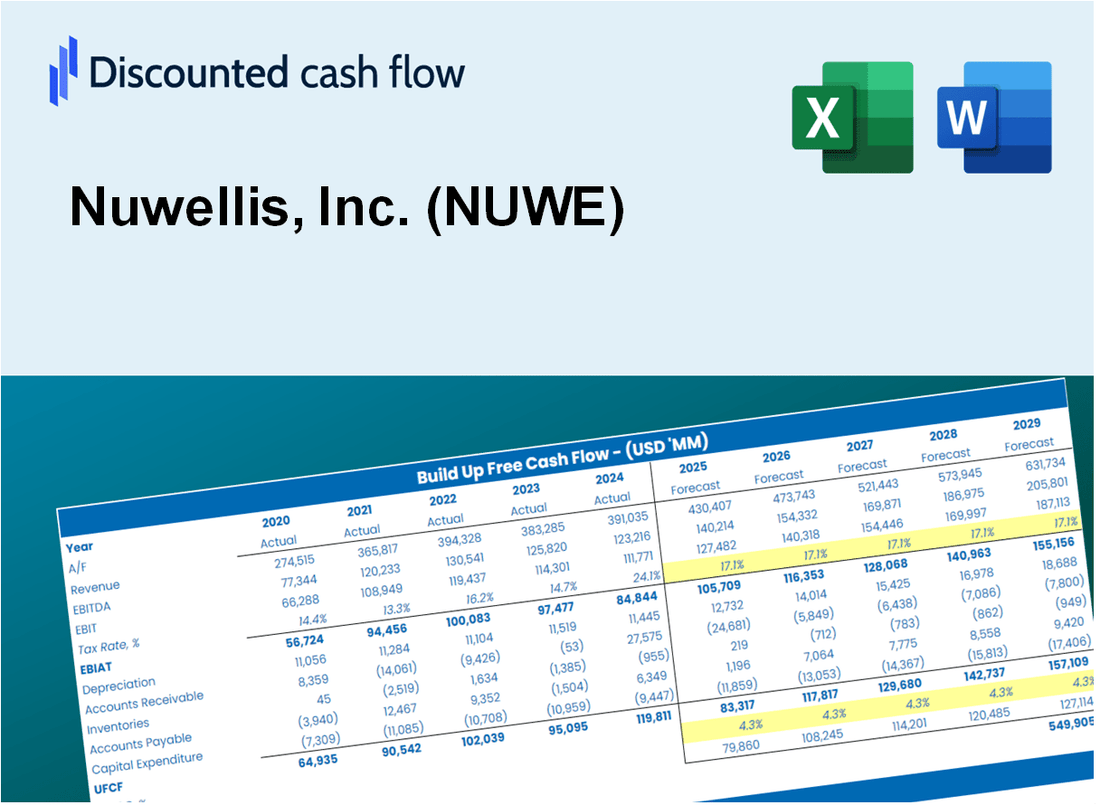
Discounted Cash Flow (DCF) - (USD MM)
| Year | AY1 2020 |
AY2 2021 |
AY3 2022 |
AY4 2023 |
AY5 2024 |
FY1 2025 |
FY2 2026 |
FY3 2027 |
FY4 2028 |
FY5 2029 |
|---|---|---|---|---|---|---|---|---|---|---|
| Revenue | 7.4 | 7.9 | 8.5 | 8.9 | 8.7 | 9.1 | 9.5 | 9.9 | 10.3 | 10.7 |
| Revenue Growth, % | 0 | 6.45 | 7.85 | 3.76 | -1.4 | 4.17 | 4.17 | 4.17 | 4.17 | 4.17 |
| EBITDA | -16.7 | -19.1 | -4.9 | -16.4 | -5.2 | -7.6 | -7.9 | -8.2 | -8.6 | -8.9 |
| EBITDA, % | -223.79 | -240.59 | -57.32 | -184.52 | -59.99 | -83.46 | -83.46 | -83.46 | -83.46 | -83.46 |
| Depreciation | .4 | .5 | .4 | .4 | .3 | .4 | .4 | .5 | .5 | .5 |
| Depreciation, % | 5.05 | 6.16 | 4.35 | 4.08 | 3.55 | 4.64 | 4.64 | 4.64 | 4.64 | 4.64 |
| EBIT | -17.0 | -19.5 | -5.3 | -16.7 | -5.6 | -7.7 | -8.1 | -8.4 | -8.8 | -9.1 |
| EBIT, % | -228.84 | -246.75 | -61.68 | -188.61 | -63.54 | -85.04 | -85.04 | -85.04 | -85.04 | -85.04 |
| Total Cash | 14.4 | 24.2 | 18.3 | 3.8 | 5.1 | 7.3 | 7.6 | 7.9 | 8.3 | 8.6 |
| Total Cash, percent | .0 | .0 | .0 | .0 | .0 | .0 | .0 | .0 | .0 | .0 |
| Account Receivables | .9 | .8 | 1.4 | 2.0 | 1.7 | 1.5 | 1.5 | 1.6 | 1.6 | 1.7 |
| Account Receivables, % | 12.16 | 9.47 | 16.46 | 22.01 | 19.76 | 15.97 | 15.97 | 15.97 | 15.97 | 15.97 |
| Inventories | 3.0 | 2.8 | 2.7 | 2.0 | 1.7 | 2.7 | 2.8 | 2.9 | 3.1 | 3.2 |
| Inventories, % | 39.74 | 35.89 | 31.15 | 22.53 | 19.66 | 29.79 | 29.79 | 29.79 | 29.79 | 29.79 |
| Accounts Payable | 1.1 | 1.4 | 2.2 | 2.4 | 1.6 | 1.9 | 2.0 | 2.1 | 2.2 | 2.2 |
| Accounts Payable, % | 14.74 | 17.85 | 26.28 | 26.85 | 18.76 | 20.9 | 20.9 | 20.9 | 20.9 | 20.9 |
| Capital Expenditure | -.3 | -.2 | -.1 | -.2 | -.1 | -.2 | -.2 | -.2 | -.2 | -.3 |
| Capital Expenditure, % | -4 | -2.76 | -1.43 | -2.8 | -0.6865 | -2.34 | -2.34 | -2.34 | -2.34 | -2.34 |
| Tax Rate, % | 4.8 | 4.8 | 4.8 | 4.8 | 4.8 | 4.8 | 4.8 | 4.8 | 4.8 | 4.8 |
| EBITAT | -17.0 | -19.6 | -5.3 | -16.7 | -5.3 | -7.7 | -8.0 | -8.3 | -8.7 | -9.0 |
| Depreciation | ||||||||||
| Changes in Account Receivables | ||||||||||
| Changes in Inventories | ||||||||||
| Changes in Accounts Payable | ||||||||||
| Capital Expenditure | ||||||||||
| UFCF | -19.7 | -18.7 | -4.7 | -16.4 | -5.3 | -7.9 | -7.9 | -8.2 | -8.5 | -8.9 |
| WACC, % | 133.24 | 133.24 | 133.24 | 133.24 | 127.03 | 131.99 | 131.99 | 131.99 | 131.99 | 131.99 |
| PV UFCF | ||||||||||
| SUM PV UFCF | -6.0 | |||||||||
| Long Term Growth Rate, % | 2.00 | |||||||||
| Free cash flow (T + 1) | -9 | |||||||||
| Terminal Value | -7 | |||||||||
| Present Terminal Value | 0 | |||||||||
| Enterprise Value | -6 | |||||||||
| Net Debt | -5 | |||||||||
| Equity Value | -2 | |||||||||
| Diluted Shares Outstanding, MM | 1 | |||||||||
| Equity Value Per Share | -1.14 |
What You Will Get
- Real NUWE Financials: Access to historical and projected data for precise valuation.
- Customizable Inputs: Adjust WACC, tax rates, revenue growth, and capital expenditures as needed.
- Dynamic Calculations: Intrinsic value and NPV are computed automatically.
- Scenario Analysis: Explore various scenarios to assess Nuwellis, Inc.'s future performance.
- User-Friendly Design: Designed for professionals while remaining approachable for newcomers.
Key Features
- 🔍 Real-Life NUWE Financials: Pre-filled historical and projected data for Nuwellis, Inc.
- ✏️ Fully Customizable Inputs: Adjust all critical parameters (yellow cells) like WACC, growth %, and tax rates.
- 📊 Professional DCF Valuation: Built-in formulas calculate Nuwellis’s intrinsic value using the Discounted Cash Flow method.
- ⚡ Instant Results: Visualize Nuwellis’s valuation instantly after making changes.
- Scenario Analysis: Test and compare outcomes for various financial assumptions side-by-side.
How It Works
- Download the Template: Gain immediate access to the Excel-based NUWE DCF Calculator.
- Input Your Assumptions: Modify the yellow-highlighted cells for growth rates, WACC, margins, and additional parameters.
- Instant Calculations: The model automatically recalculates Nuwellis, Inc.'s intrinsic value.
- Test Scenarios: Experiment with various assumptions to assess potential changes in valuation.
- Analyze and Decide: Leverage the results to inform your investment or financial evaluation.
Why Choose This Calculator for Nuwellis, Inc. (NUWE)?
- Designed for Experts: A sophisticated tool utilized by financial analysts, investors, and industry professionals.
- Accurate Data: Nuwellis’ historical and projected financials preloaded for reliable analysis.
- Flexible Scenario Analysis: Easily test various forecasts and assumptions to gauge potential outcomes.
- Comprehensive Outputs: Instantly computes intrinsic value, NPV, and other essential metrics.
- User-Friendly Interface: Step-by-step guidance ensures a smooth experience throughout the calculation process.
Who Should Use Nuwellis, Inc. (NUWE)?
- Healthcare Professionals: Understand innovative treatment options and their impact on patient care.
- Researchers: Integrate advanced technologies into studies on fluid management and patient outcomes.
- Investors: Evaluate market trends and assess the potential of Nuwellis, Inc. (NUWE) within the medical device sector.
- Industry Analysts: Enhance your analysis with comprehensive data on product efficacy and market positioning.
- Medical Practitioners: Discover how Nuwellis, Inc. (NUWE) solutions can improve clinical practices and patient management.
What the Template Contains
- Preloaded NUWE Data: Historical and projected financial data, including revenue, EBIT, and capital expenditures.
- DCF and WACC Models: Professional-grade sheets for calculating intrinsic value and Weighted Average Cost of Capital.
- Editable Inputs: Yellow-highlighted cells for adjusting revenue growth, tax rates, and discount rates.
- Financial Statements: Comprehensive annual and quarterly financials for deeper analysis.
- Key Ratios: Profitability, leverage, and efficiency ratios to evaluate performance.
- Dashboard and Charts: Visual summaries of valuation outcomes and assumptions.
Disclaimer
All information, articles, and product details provided on this website are for general informational and educational purposes only. We do not claim any ownership over, nor do we intend to infringe upon, any trademarks, copyrights, logos, brand names, or other intellectual property mentioned or depicted on this site. Such intellectual property remains the property of its respective owners, and any references here are made solely for identification or informational purposes, without implying any affiliation, endorsement, or partnership.
We make no representations or warranties, express or implied, regarding the accuracy, completeness, or suitability of any content or products presented. Nothing on this website should be construed as legal, tax, investment, financial, medical, or other professional advice. In addition, no part of this site—including articles or product references—constitutes a solicitation, recommendation, endorsement, advertisement, or offer to buy or sell any securities, franchises, or other financial instruments, particularly in jurisdictions where such activity would be unlawful.
All content is of a general nature and may not address the specific circumstances of any individual or entity. It is not a substitute for professional advice or services. Any actions you take based on the information provided here are strictly at your own risk. You accept full responsibility for any decisions or outcomes arising from your use of this website and agree to release us from any liability in connection with your use of, or reliance upon, the content or products found herein.